UDOO-X86 Part 2: Roaring performance // Review
In Part 1 of this video I looked at the UDOO-X86 from the electronics Maker perspective.
In Part 2 I’ll be looking at the CPU and graphics performance of the board on Linux as well as RemixOS.
UDOO-X86 Phoronix Tests
So,let’s get right into it. I bashed the board with a bunch of Phoronix tests over 3 days and kept track of power consumption. There were a number of areas that I tested, which covered pretty much all the use cases for this board. 1. Memory speed & cache memory. 2. CPU integer and floating point. 3. SATA I/O. 4. Perl, Python and Go execution times. 5. Audio & Video encoding. 6. Cryptography. 7. Graphics.
Memory speed & cache memory
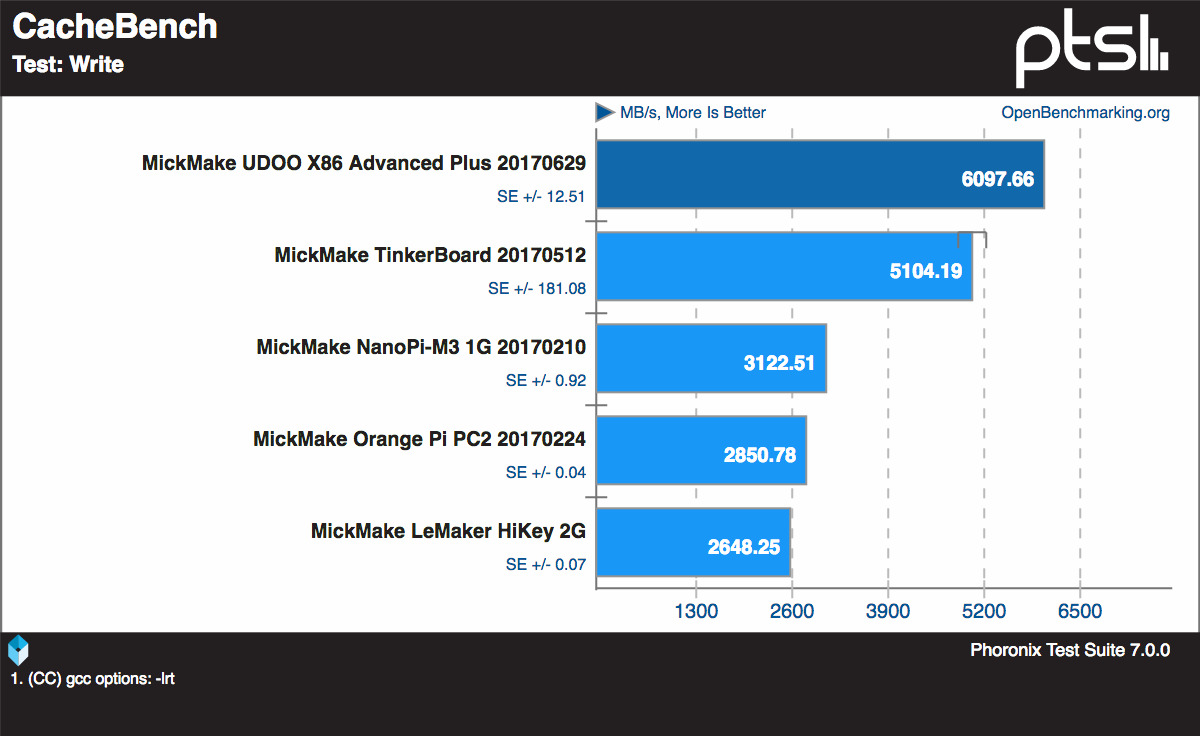
Cachebench
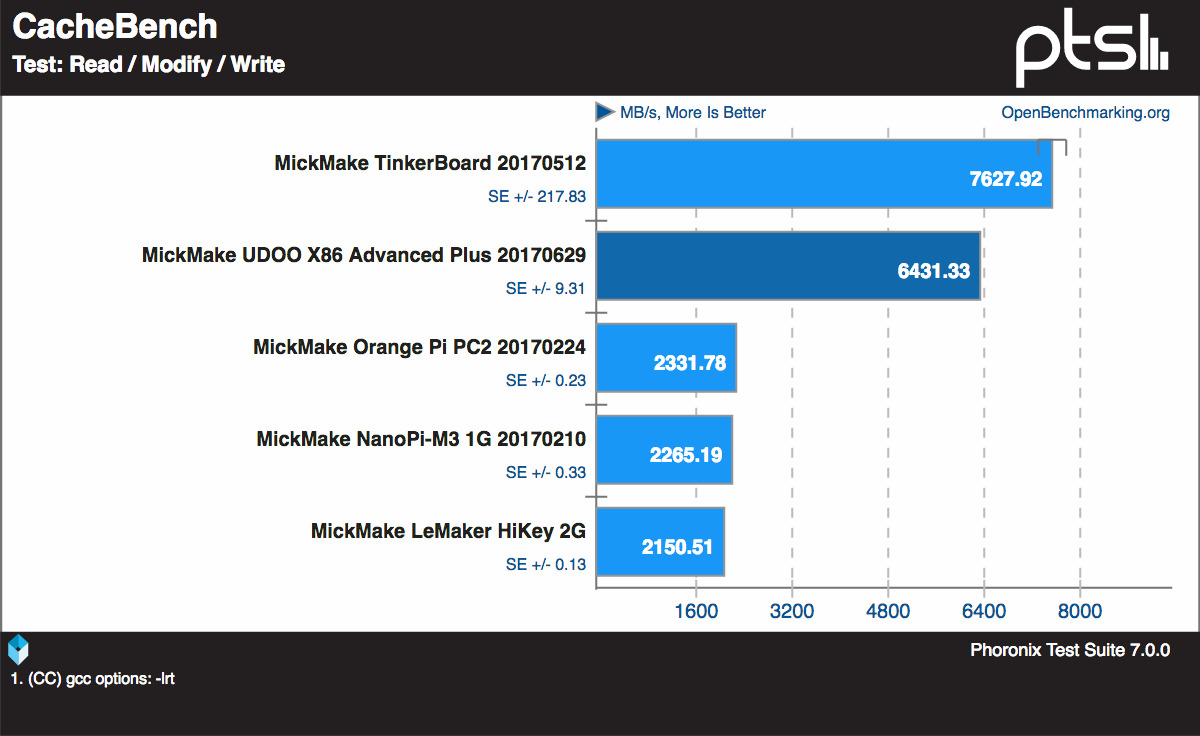
Cachebench, which tests out memory cache performance, came up with some mixed results. Read operations were slow, by almost 50% as compared to the TinkerBoard.
However, made up for the slowness with write operations,putting it almost equal with the TinkerBoard on combined tests. This isn’t so bad, really.
Himeno
Moving on to the Himeno benchmark, which is a good test of memory bandwidth and overall cache performance, it just nudges ahead of the UpBoard, whilst being 1.6x faster than the TinkerBoard, 5.1x that of the ODROID-C1 and 6.4x the Pi3. It seems the competition is heating up now.

RAM speed
Moving on to the SMP based ramspeed tests, the UDOO was 1.4x faster than the UpBoard and 2.8x faster than the Pine64. This particular benchmark didn’t have any Raspberry Pi results, so I wasn’t able to compare, but it woud be somewhere around the Pine64.


CPU integer and floating point
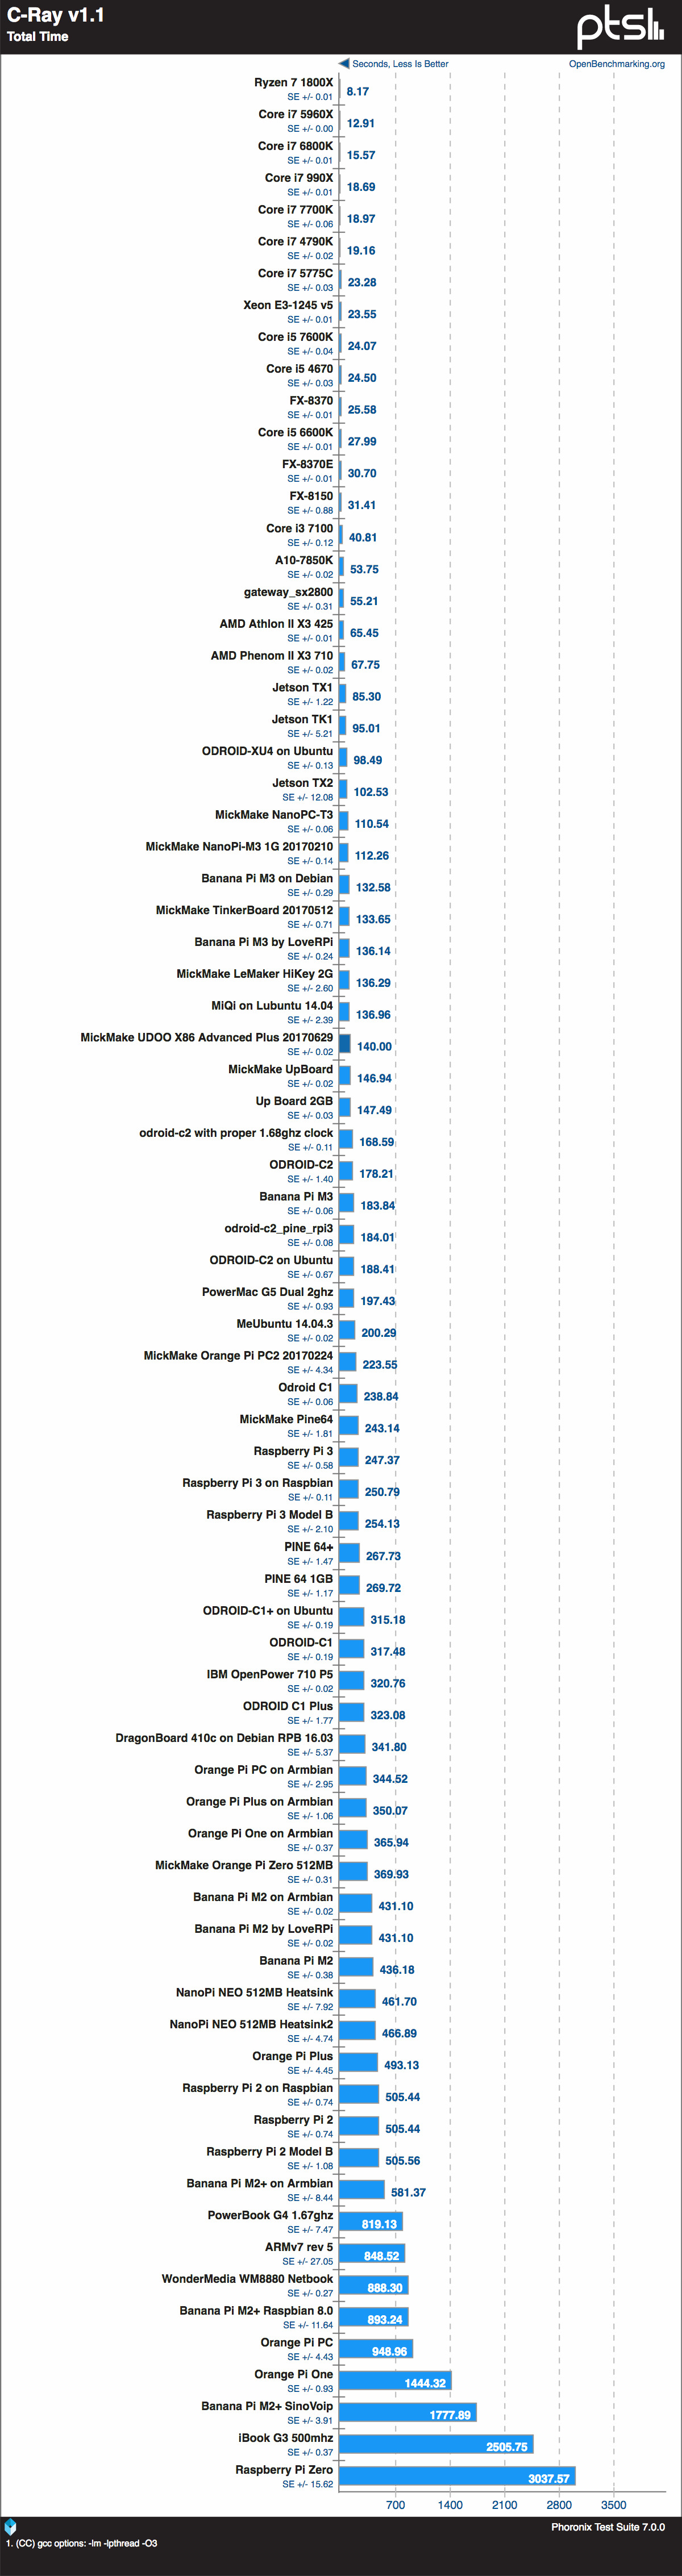
C-ray
Things changed a little when running the C-ray benchmark, which is a good indication of floating point performance. This test also can run purely from L1 cache, and highlights the slightly slow performance of cache memory on the UDOO. No surprise the RISC based architecture does well here.
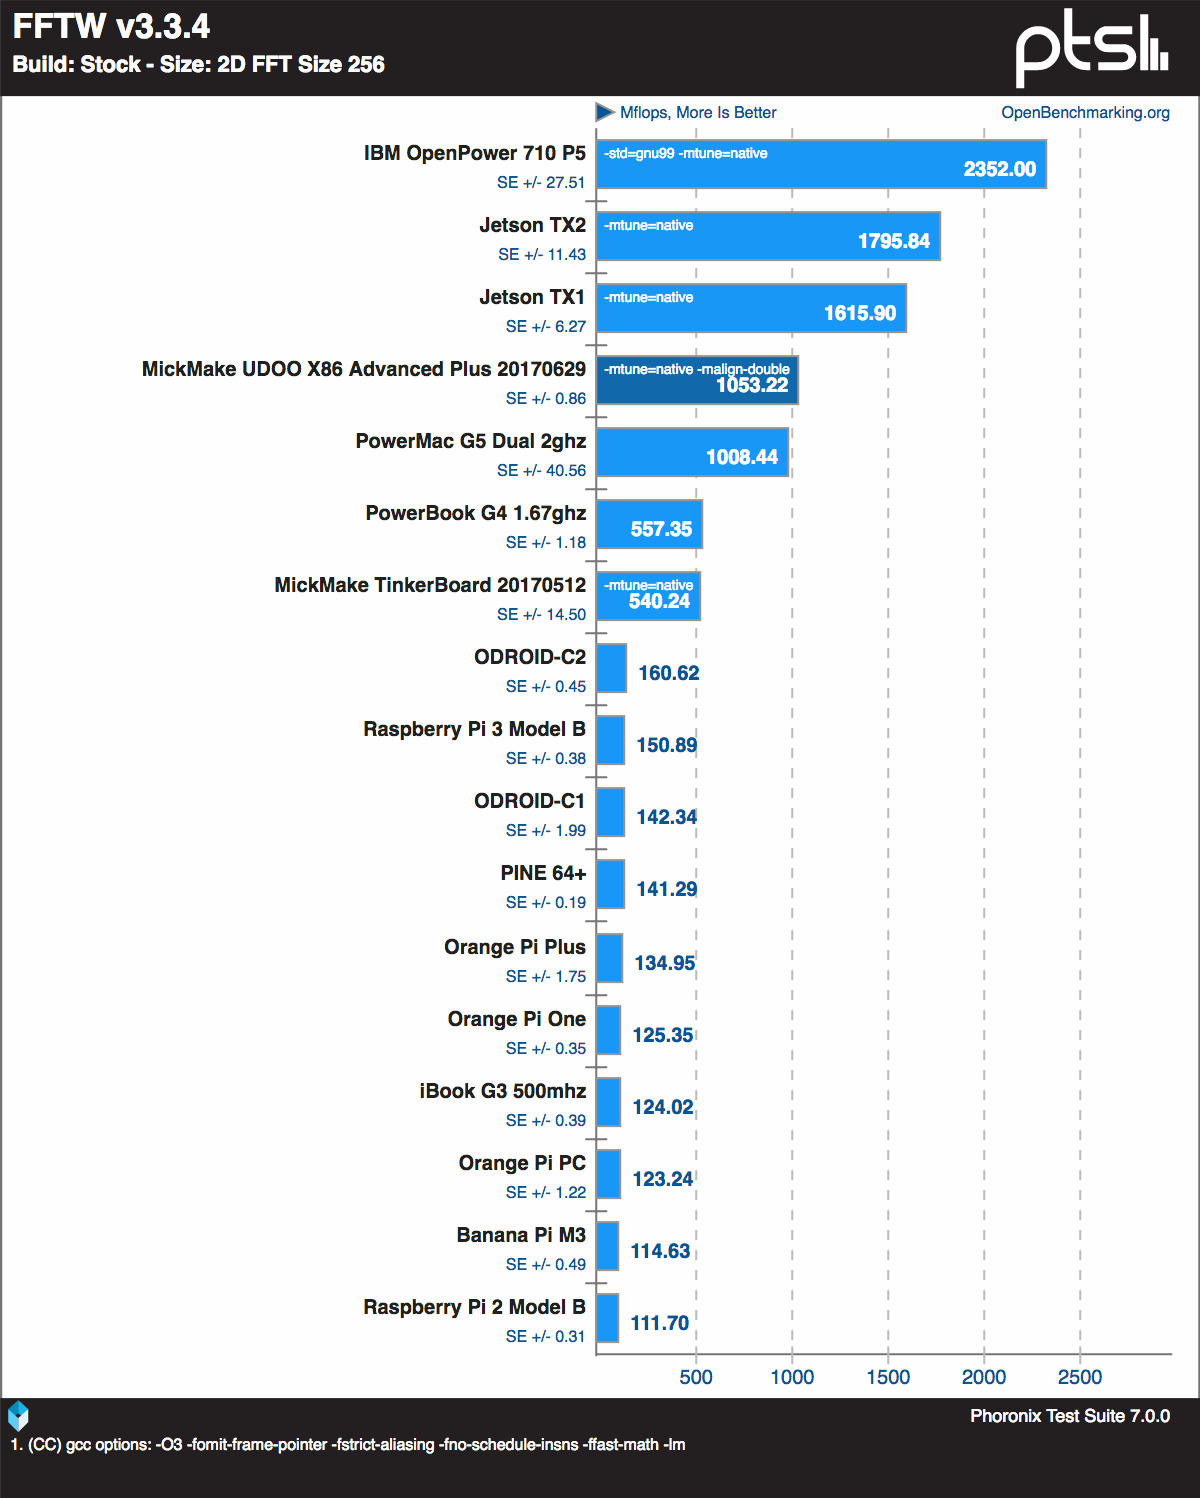
FFTW
Running some Fast Fourier Transform tests, which is another FPU benchmark, the UDOO gains back some ground being almost twice as fast as the TinkerBoard, 7x faster than the Pi3, and 9.4x the Pi2. Hmmm. Interesting.
Timed MAFFT alignment
Another floating point benchmark, the MAFFT alignment, saw the UDOO being 1.7x slower than the Jetson TX1, around the same as the UpBoard and TinkerBoard, twice as fast as the Pi3, 3x the Pi2, and 20x the Pi ZeroW.
SmallPT
SmallPT had a similar result, 2.8x the Pi3, 4.4x the Pi2, and 25x the PiZeroW.
Why am I picking on the Pi so much? Well, the reason is that the Pi has become a baseline of sorts and everyone has either used one before or knows what it is.
Essentially, out of all these tests, the UDOO-X86 is, at the most, 7x faster than a Pi3, or at the least 1.9x.
- Max: 2.7x
- Average: 3x
- Median: 2x
- Min: 1.9x
SATA I/O
If you’re thinking of using your UDOO as part of a compile cluster, then there were some interesting results running some compiles from SATA disk. The Apache compile benchmark came up 6.3x faster than the Pi3, whilst being 9x faster than the Orange Pi Zero.
Whilst compiling the Linux kernel, saw it on par with the Jetson TX2.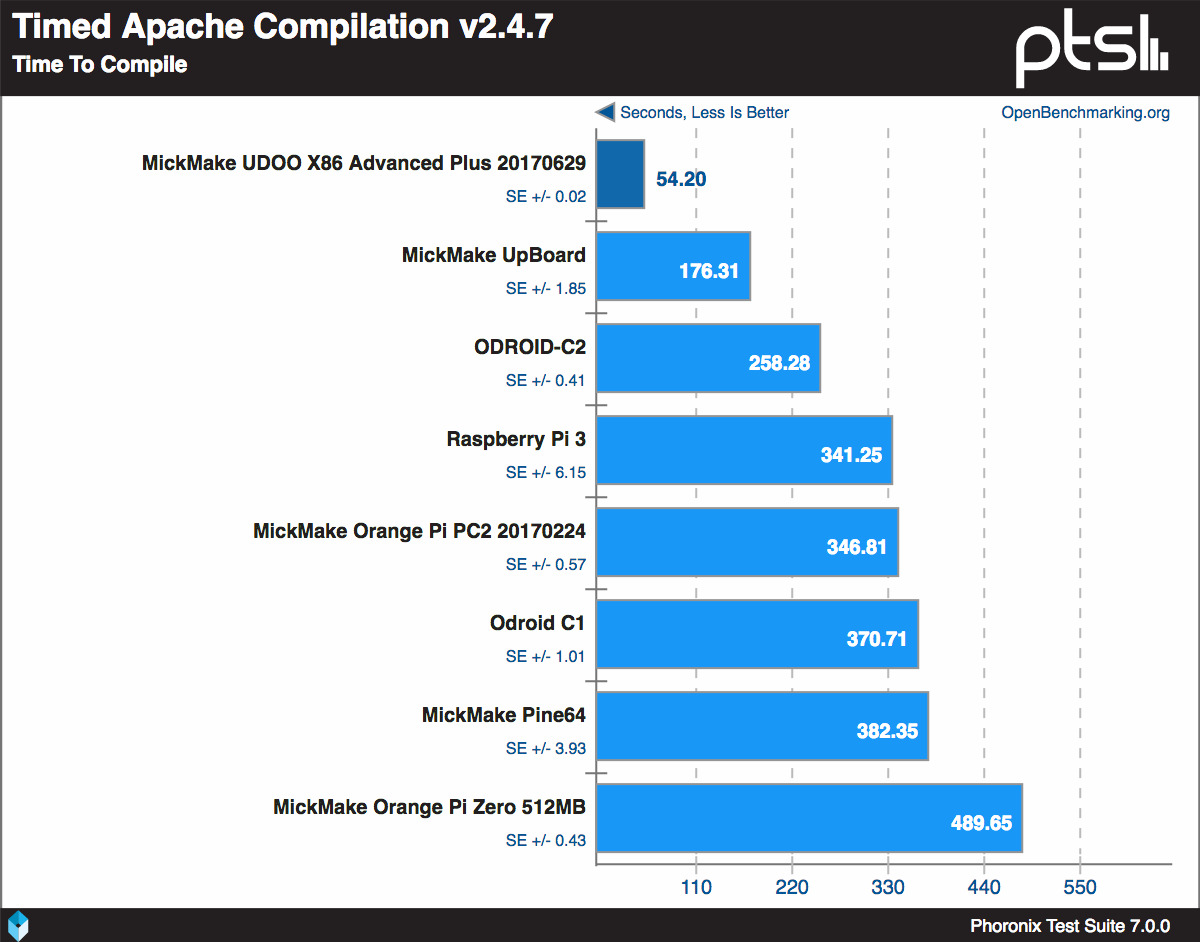
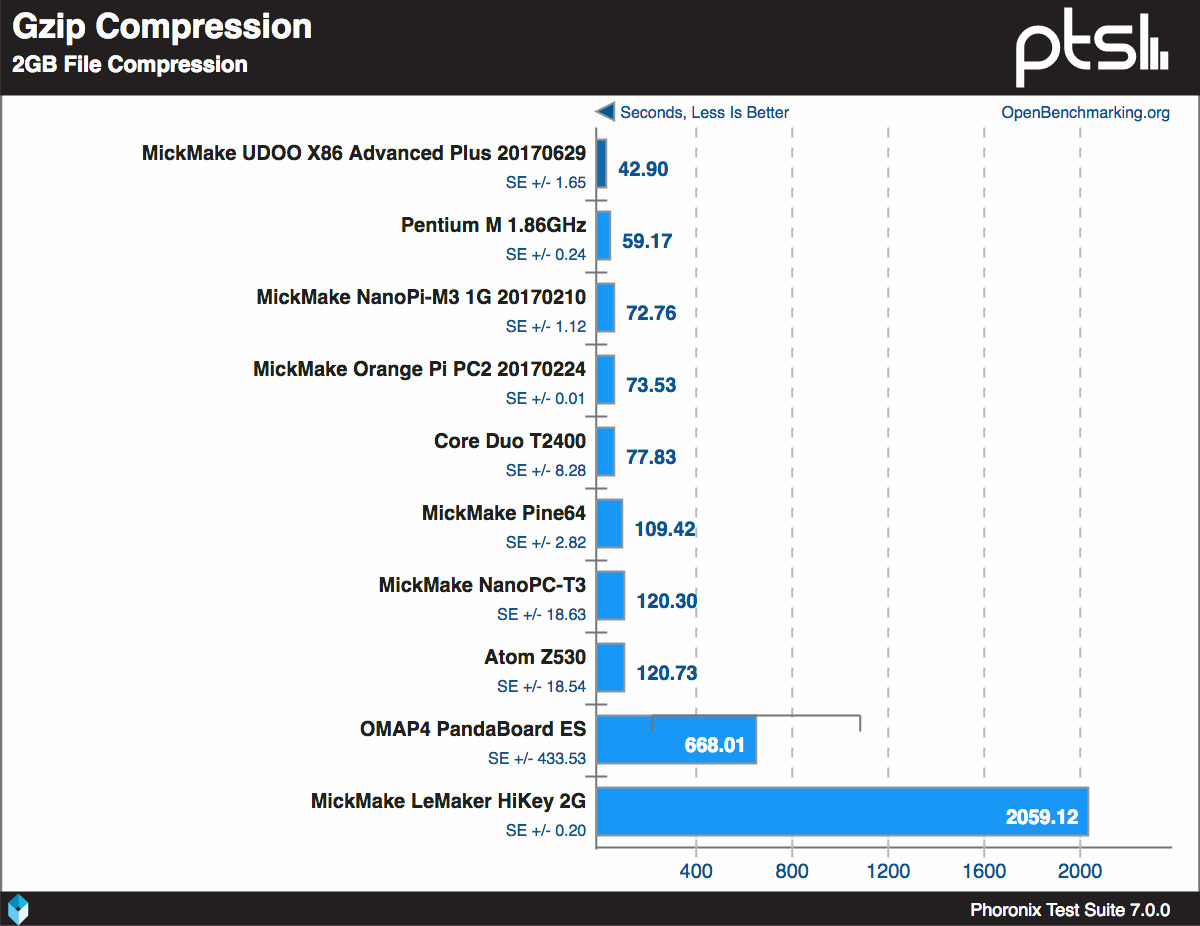
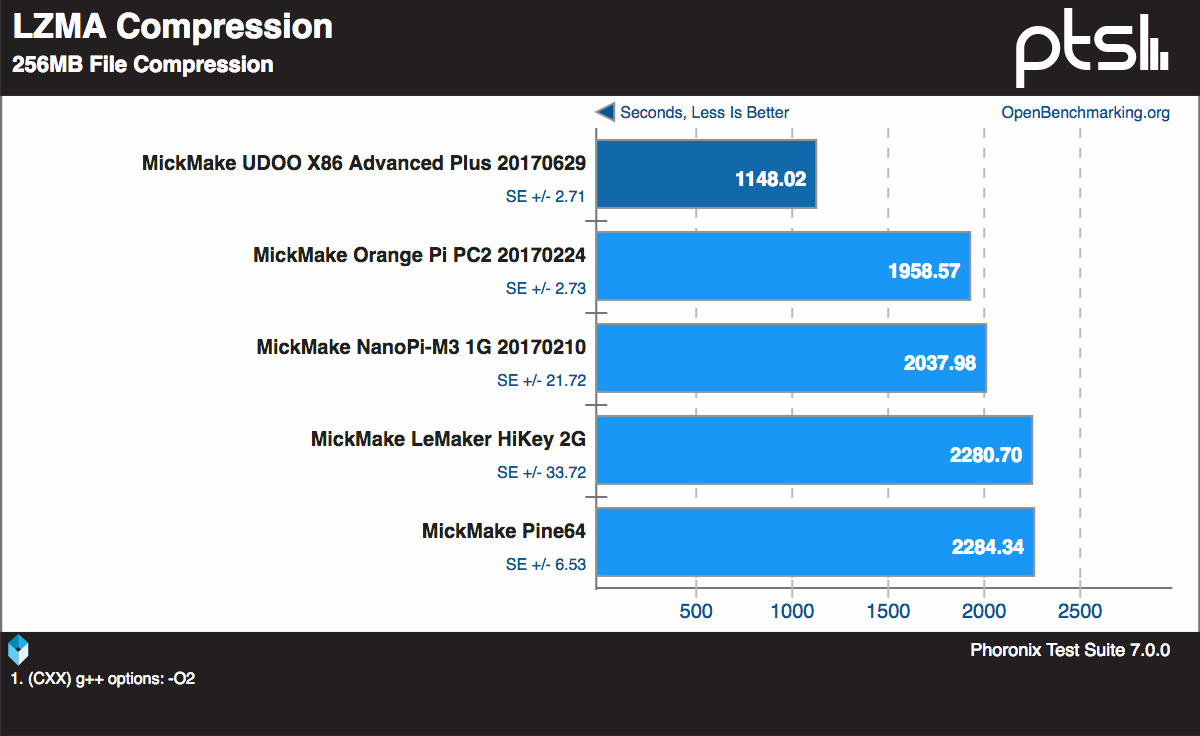
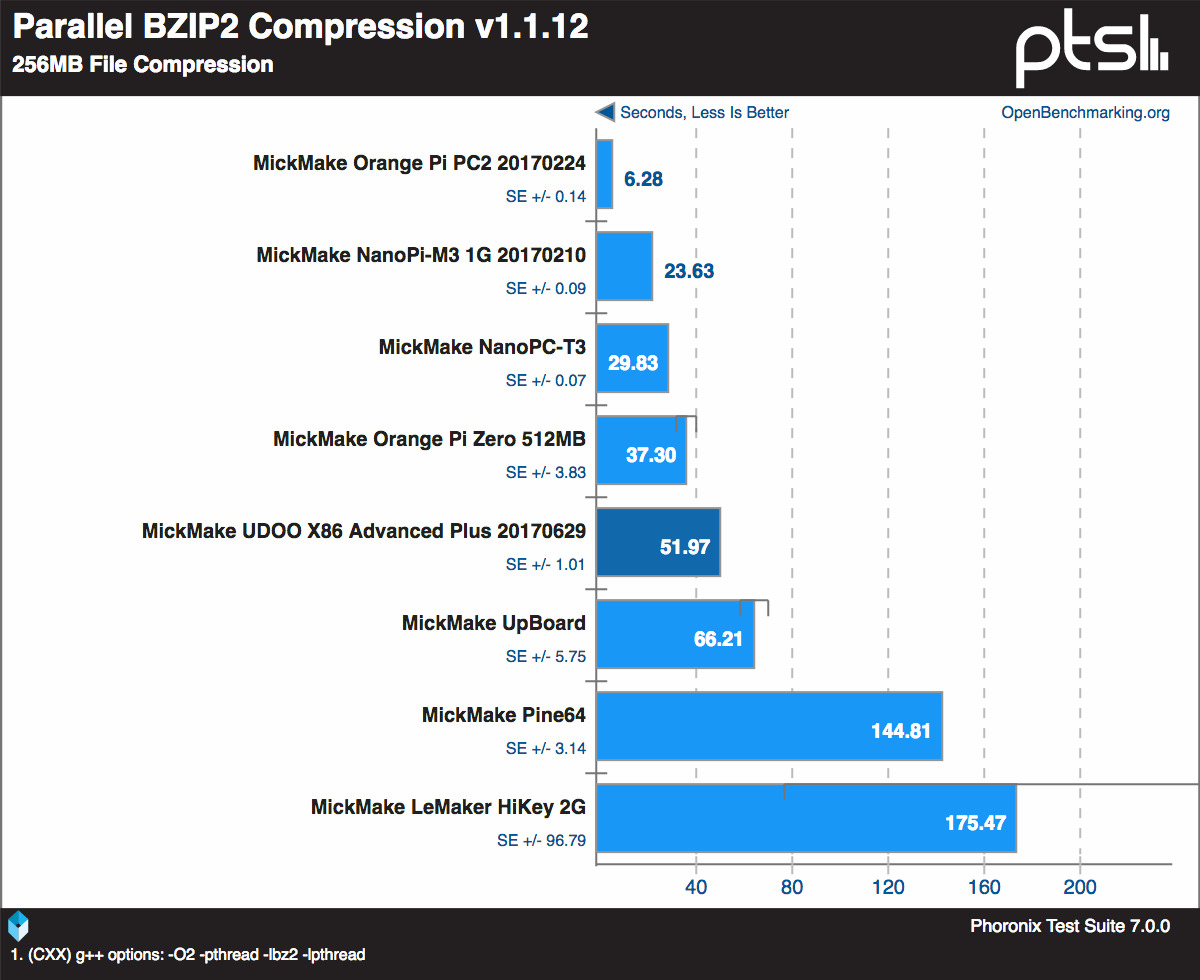
Moving on to several different compression methods, saw the performance bouncing around a bit, but generally staying at the top.
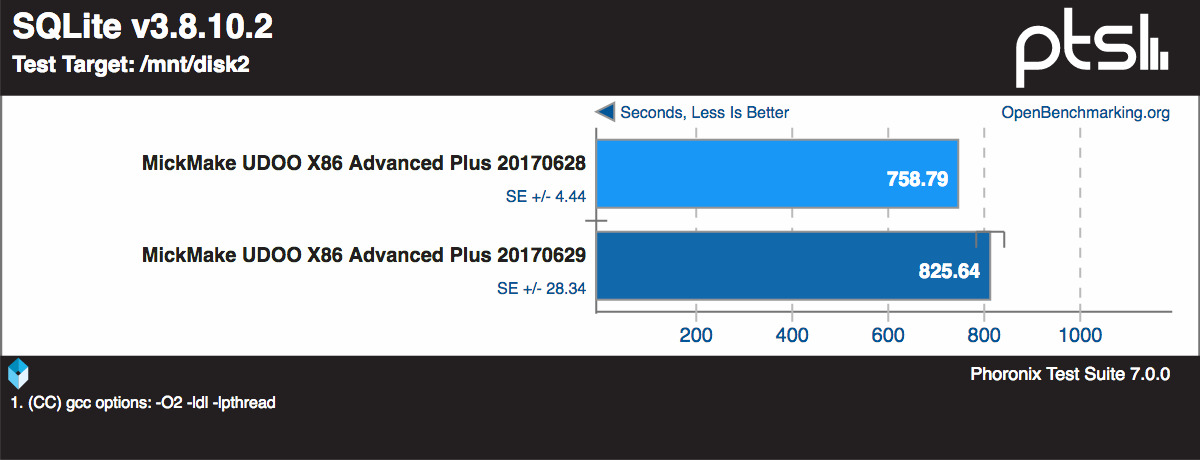
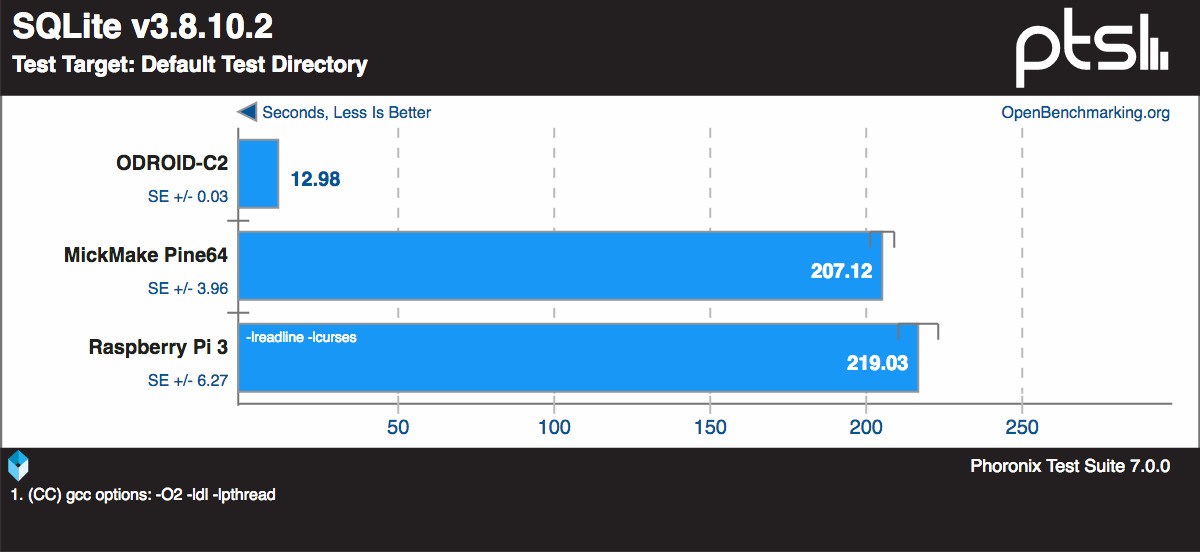
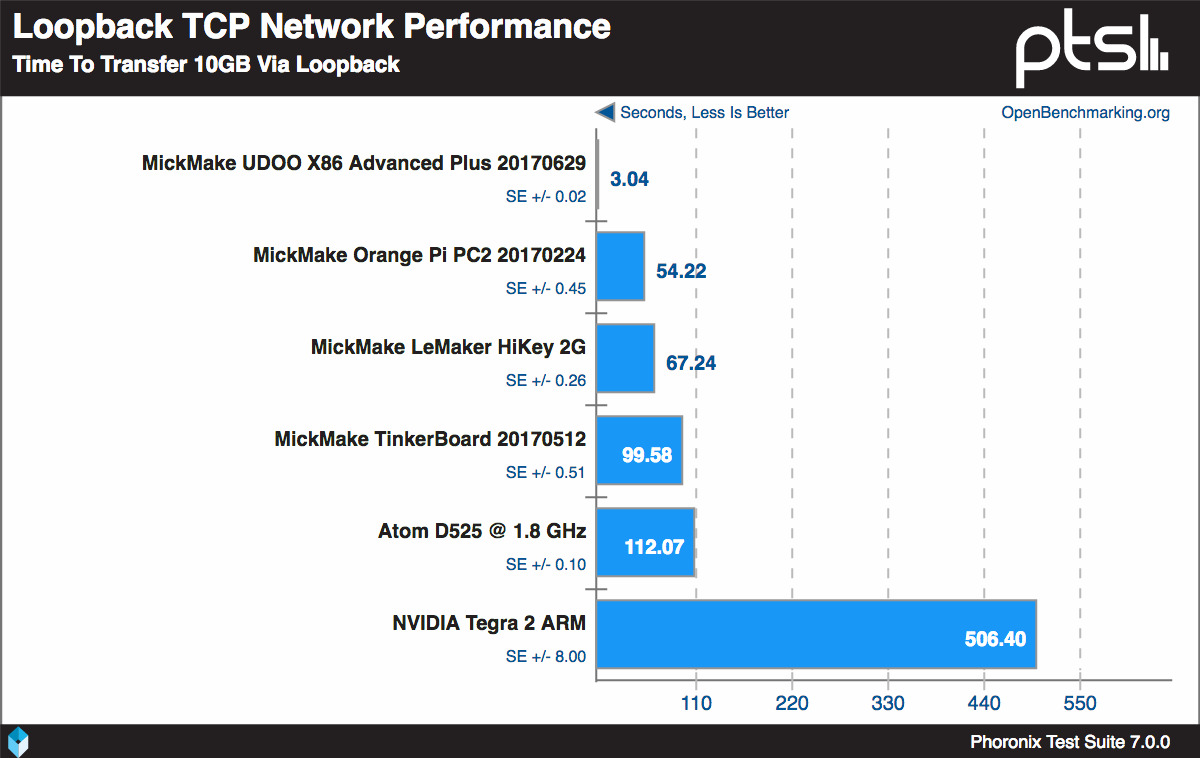
The test that surprised me was the sqlite benchmark, which ended up being 3.4x slower than the Pi3. I had to run this twice as it just looked wrong, But those were the right results.On the AIO stress test I was getting around 48MB/s on the SATA disk, which isn’t really a decent SATA performance even for my SATA1 hard disk.However, the local network loopback test left everyone else in the dust being 17.8x times the nearest board.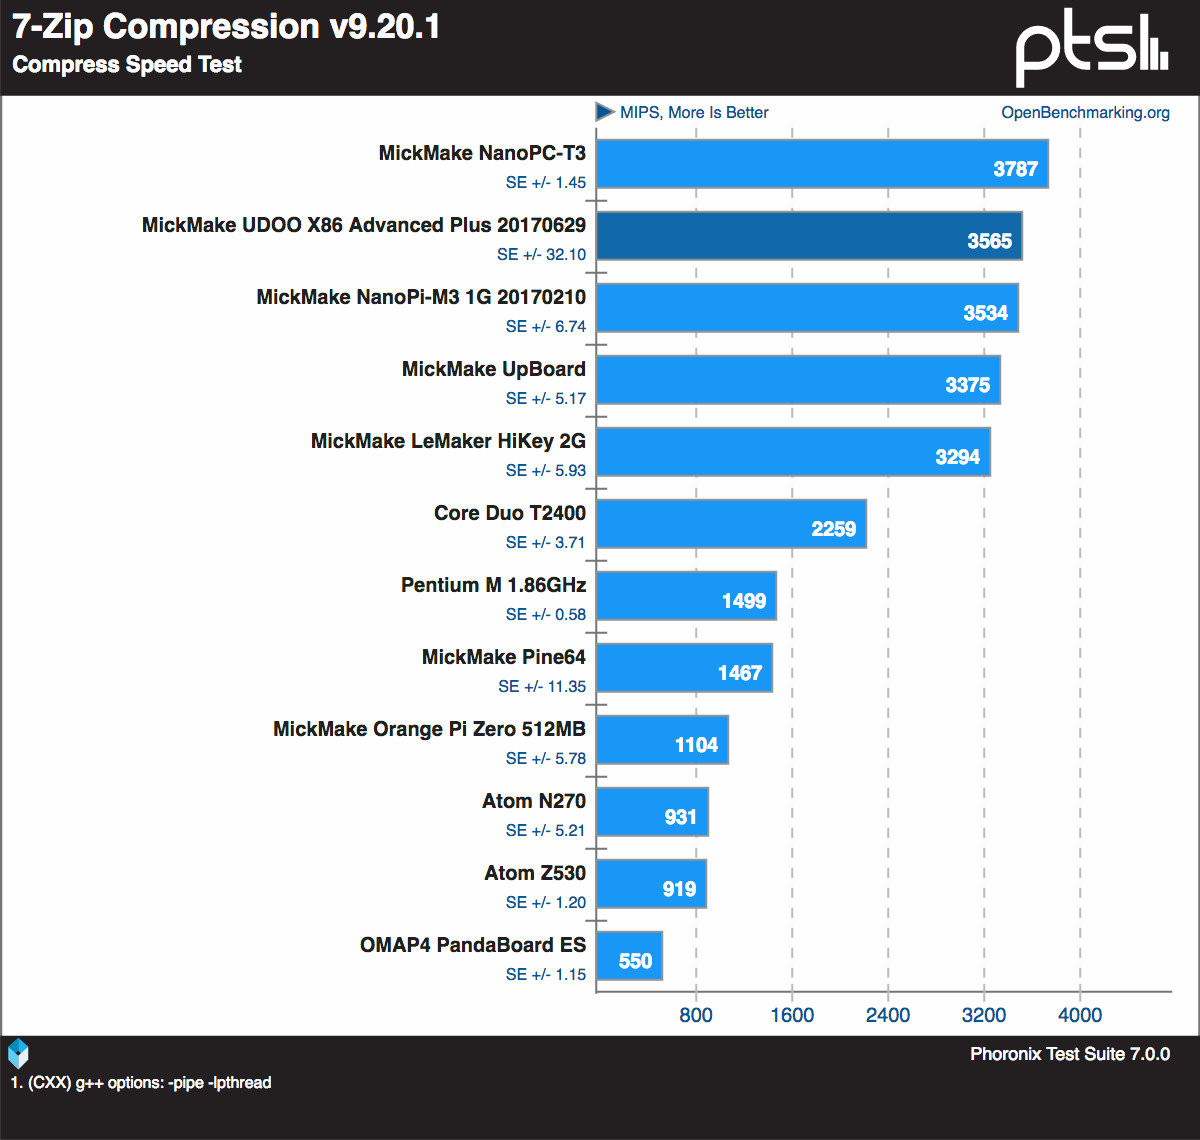

Perl, Python and Go execution times
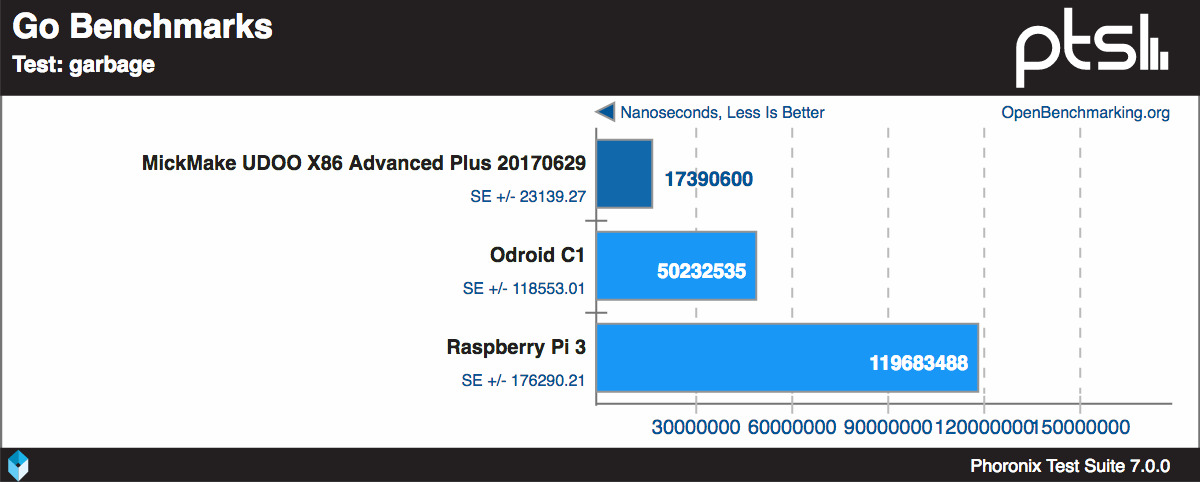
On to language performance tests. The Google Go language benchmark showed that the UDOO still has it being 4.1x faster than the Pi3 on http fetches.
12x the Pi3 on JSON,and 6.9x faster on garbage collection.Whilst Perl execution ended up being around the same, but twice as fast as the HiKey.

Audio & Video encoding
Moving on - video and audio encoding shows there’s a division between the CISC and RISC camp, being 7.5x faster than the Pine64 for ffmpeg.
And maintaining it’s fast position ahead of the Pi, which is 6.4x the Pi3 with the Pi Zero being 17x slower.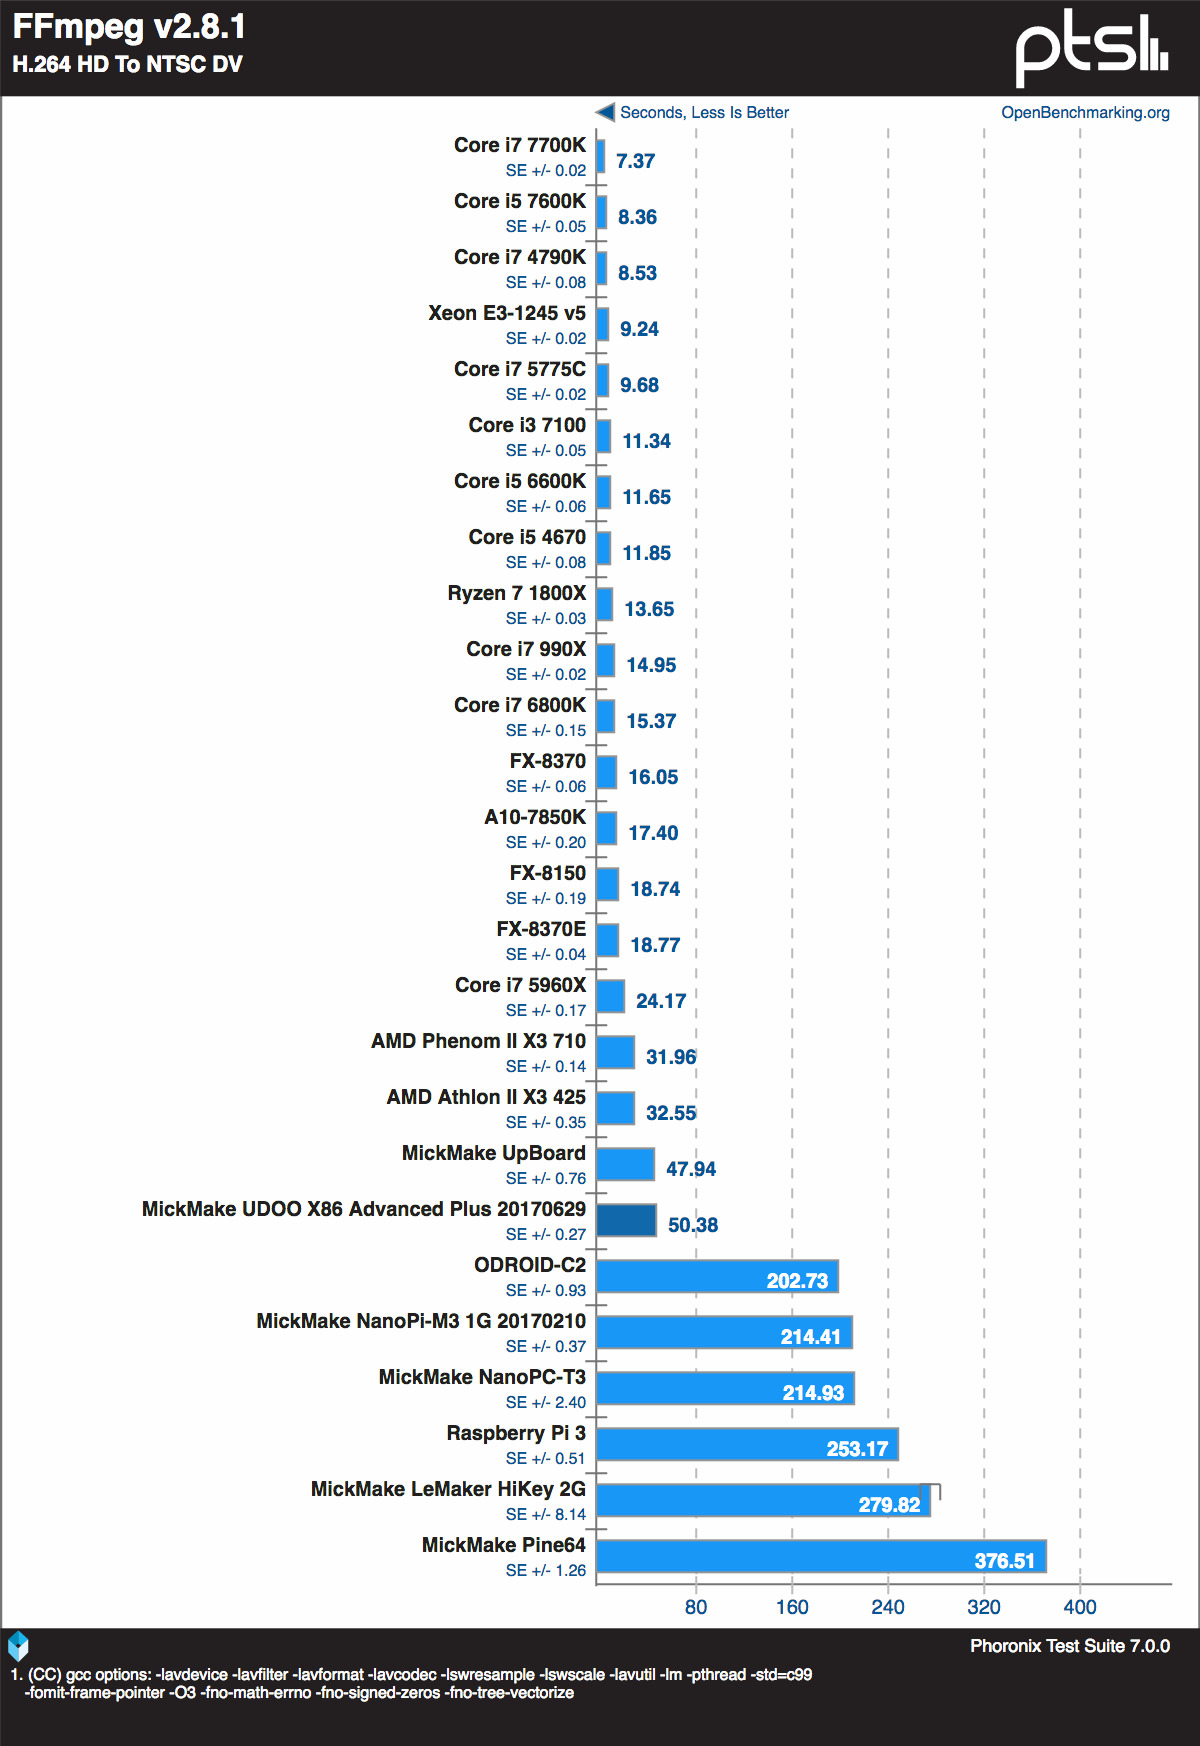
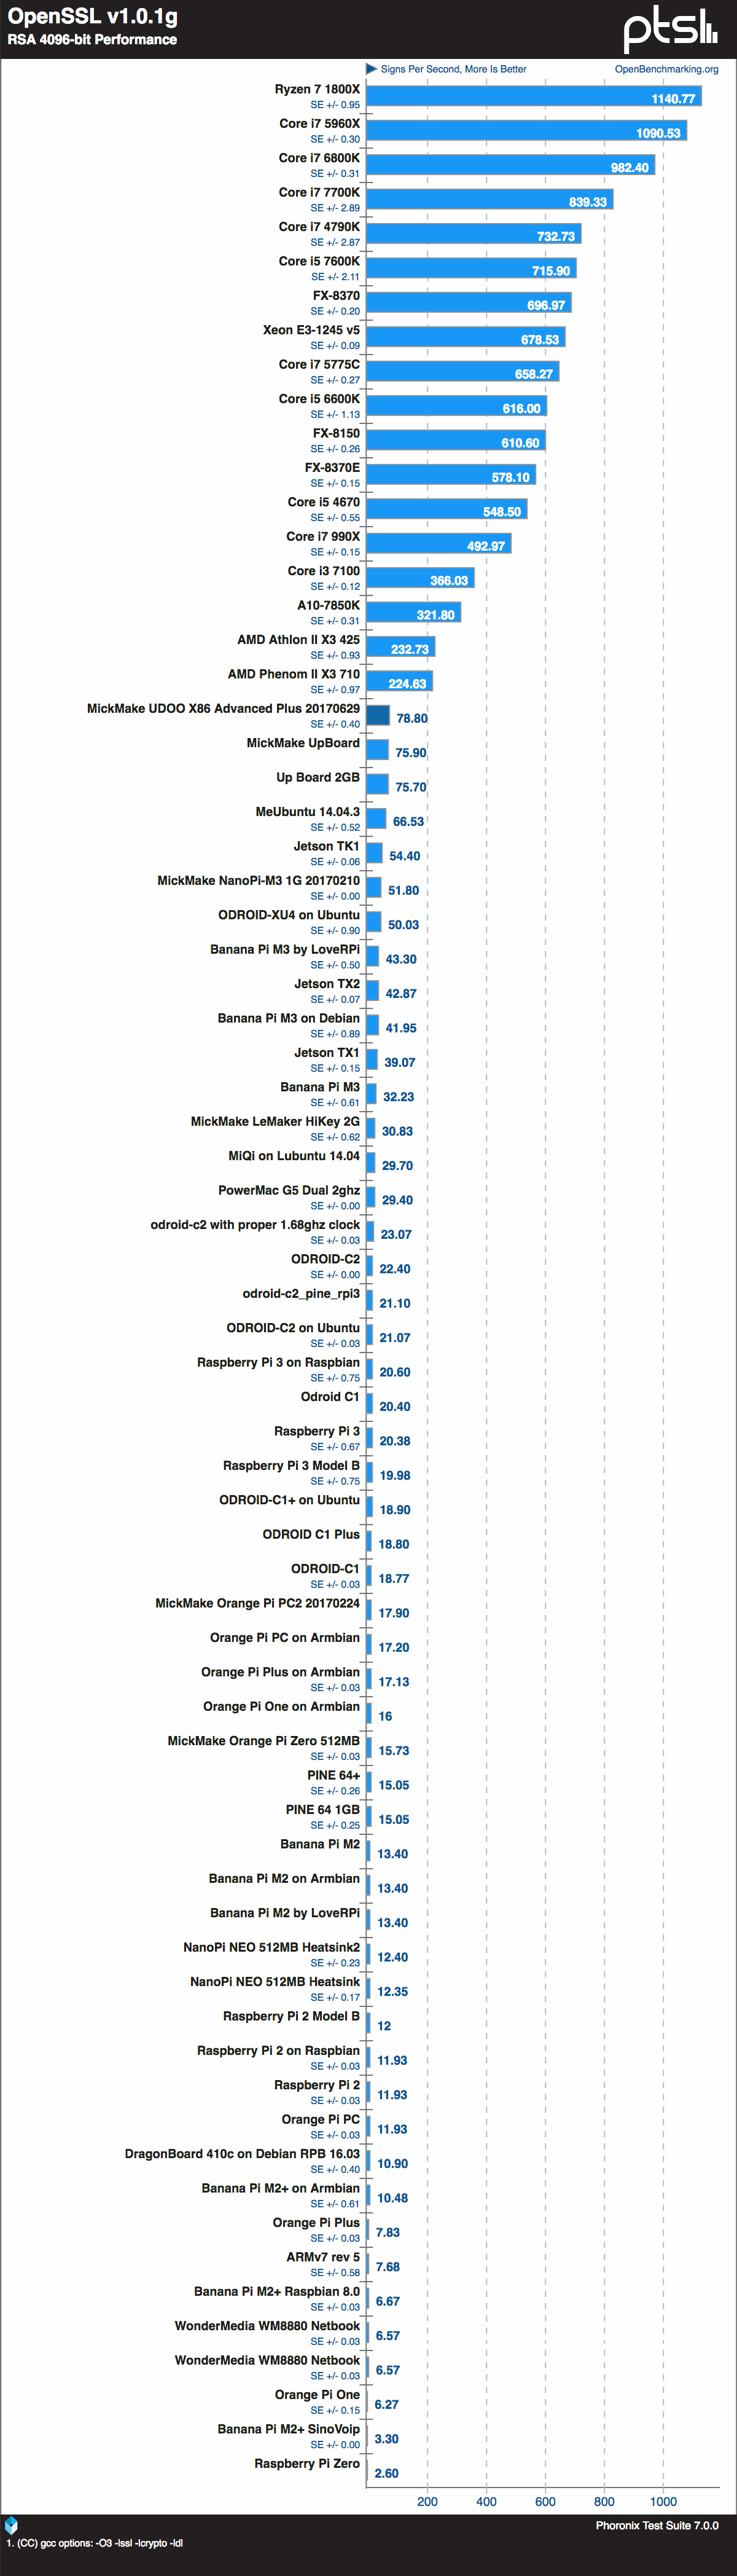
Cryptography
On to encryption performance, John The Ripper saw the UDOO on par with the HiKey and Jetson TX2, but 2.4x faster than the Pi3 and the Pi Zero trailing at the back at 17x slower.
Openssl benchmarks had a similar result: 3.9x faster than the Pi3 with the Pi Zero out at whoop-whoop… (30.3x slower) which is a place in Australia that is so far away no-one has ever been there.
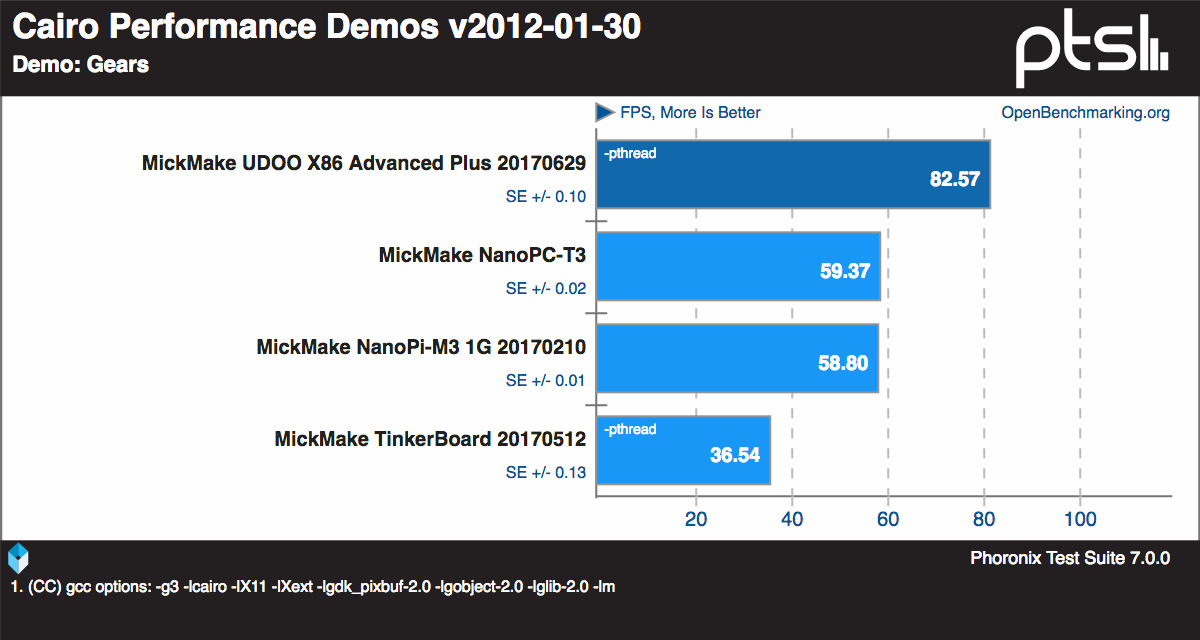
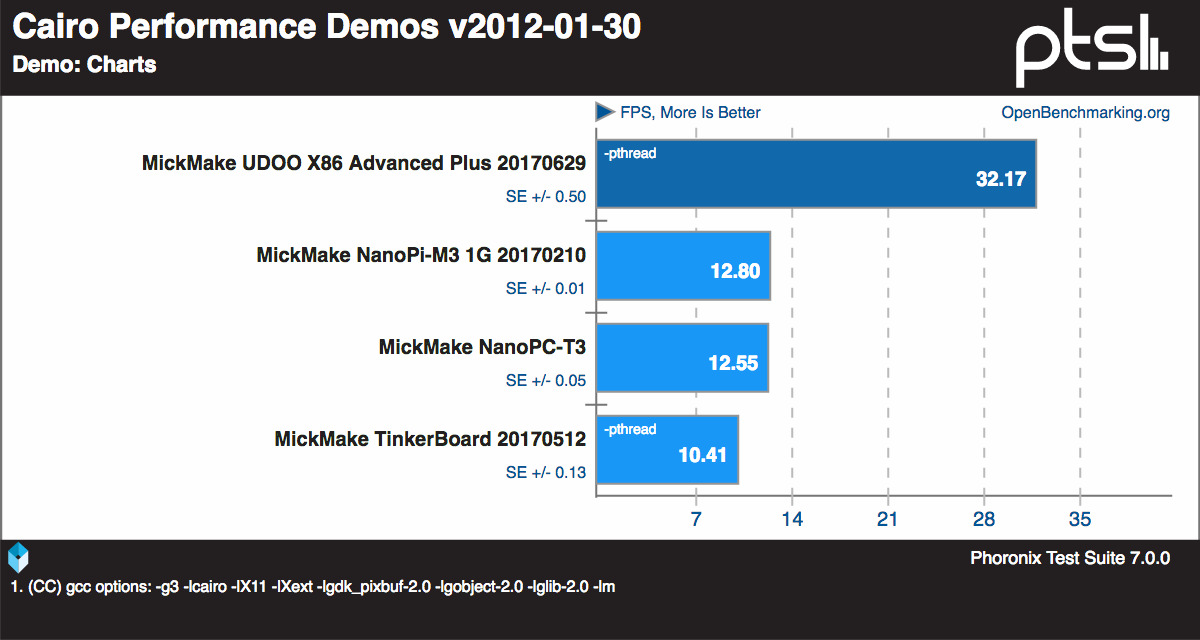
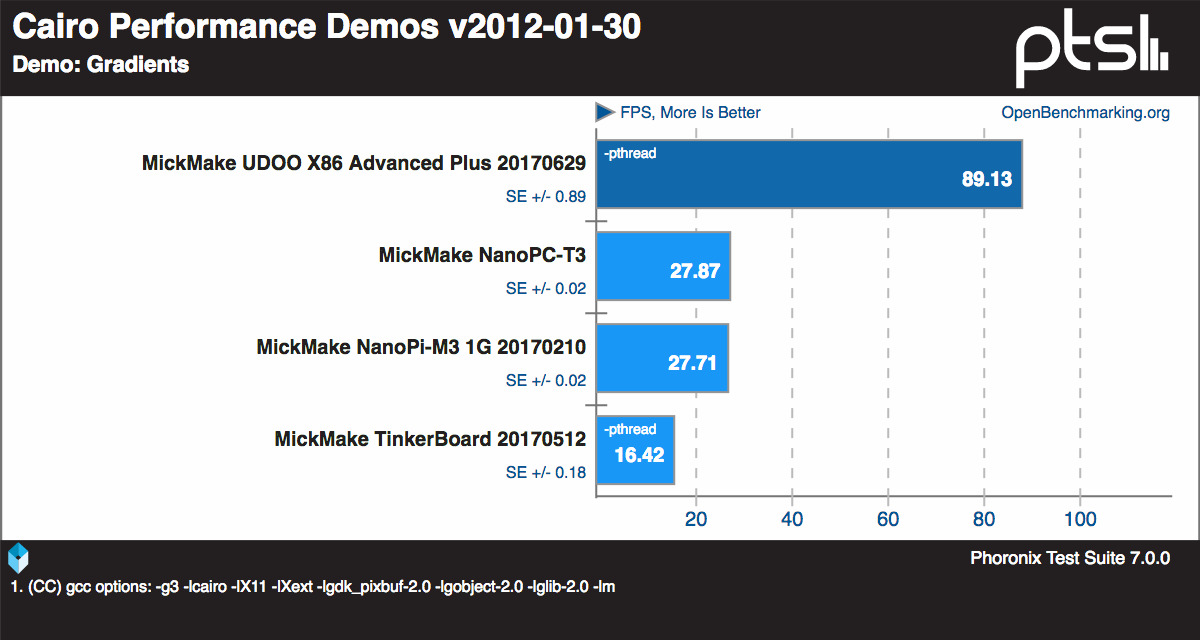
Graphics
Moving on to graphics performance. I ran a bunch of graphics tests which came up with some odd-ball results. Cairo desktop benchmarks ranged from 25x faster than the nearest board,
to 1.4x times,to 2.5x times,to 3.2x times.I’m not a gamer at all, so I don’t know if these OpenArena and World of Padma frame rates are good or not. I’d suggest checking out ETA Prime’s channel for that. I’d hazard a guess that it’s good.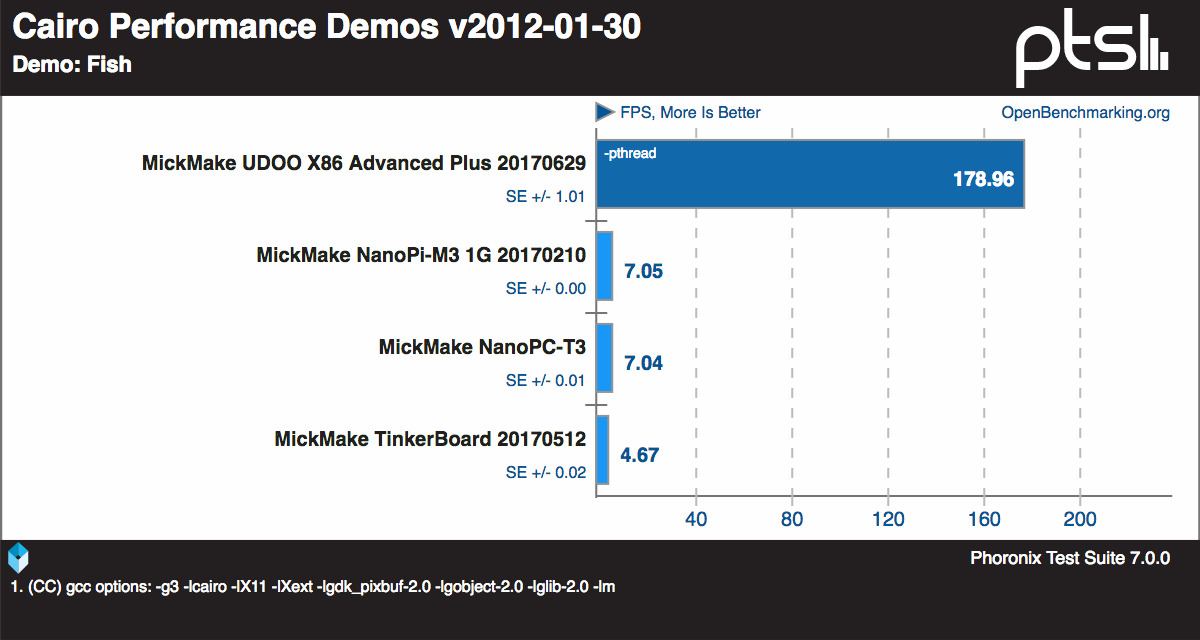
That was it for the Phoronix tests. You can check out the full list of tests on the Open Benchmarking website. So, what was the power consumption like during these tests?
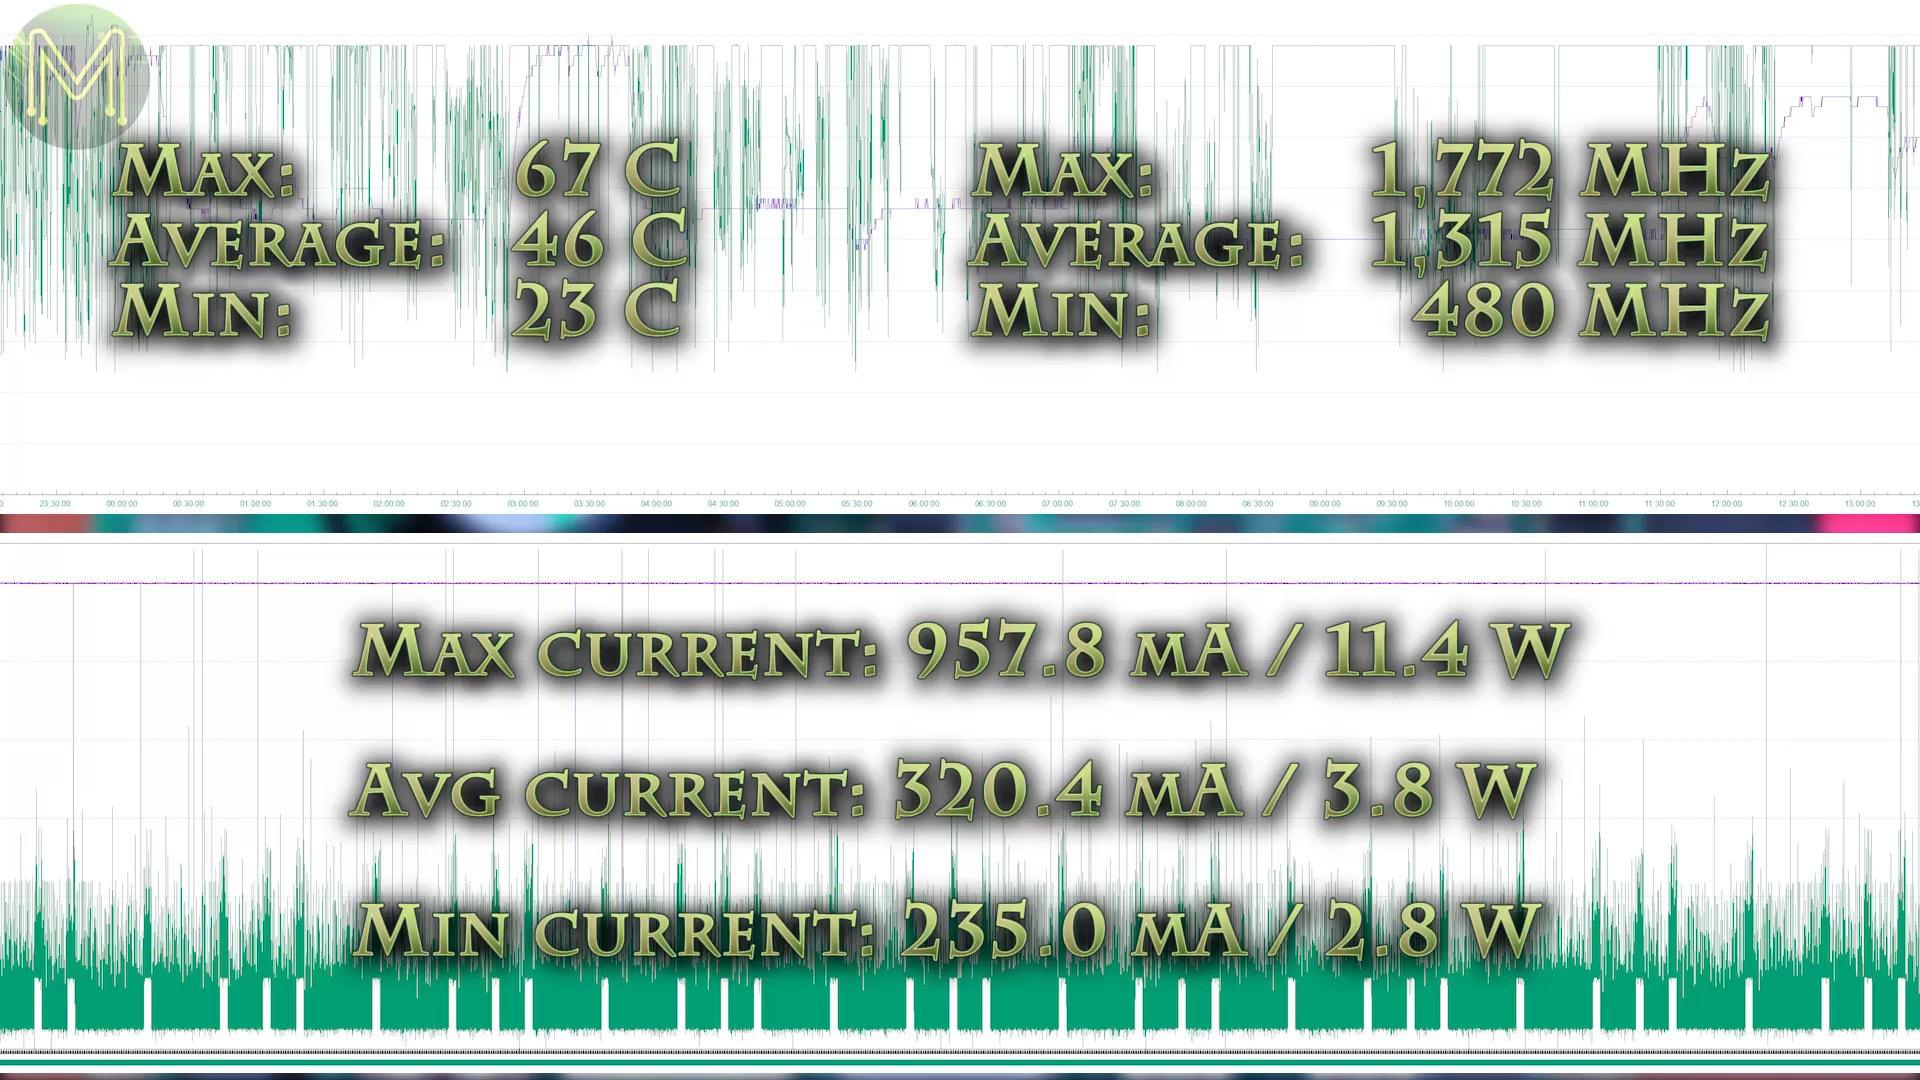
Surprisingly I saw a maximum current of 958mA, which ends up being around 11.4W.
Average current draw was around 320mA or 3.8W and minimum current draw 235mA or 2.8W.
While this was happening I saw the CPU temperature hit a max of 67C, with an average of 46C and a minimum of 23C. This was with an ambient temperature of around 17.4C. That’s pretty decent and the lowest I’ve seen on an SBC so far.
It wasn’t even hot enough to start the fan. I think this will need a followup video looking at overclocking.
- Max: 67 C
- Average: 46 C
- Median: 48 C
- Min: 23 C
Interestingly I never really saw the CPU hit the magical 2.24GHz turbo speed and only saw it reach 1.7GHz max.
- Max: 1772 MHz
- Average: 1315 MHz
- Median: 1759 MHz
- Min: 480 MHzThis happened despite me setting the CPU scaling governor to performance mode. Even attempting to set the maximum frequency doesn’t change anything.

UDOO-X86 & RemixOS
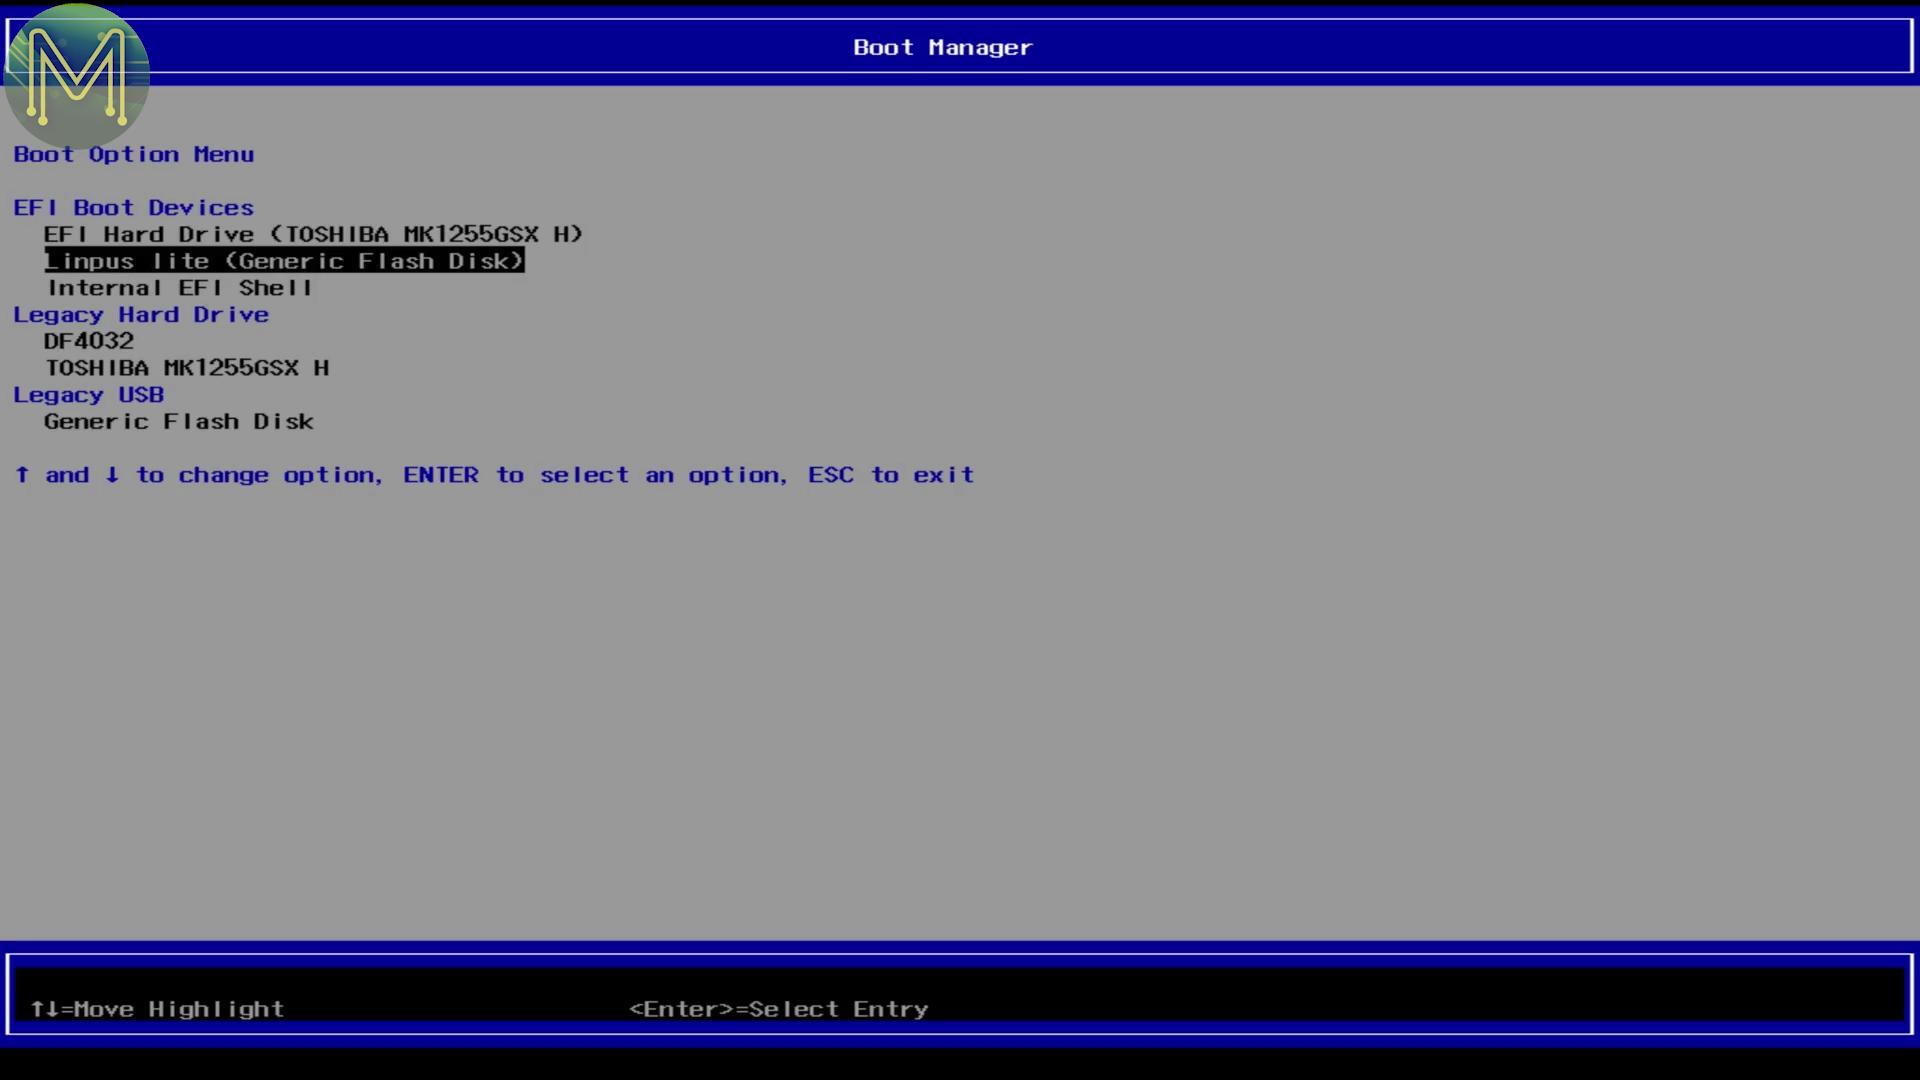
So, on to taking a look at Remix OS - this is an OS aimed at making Android feel like a desktop. I picked up v6.0 release 1 and burnt it to a USB flash drive. Changed the OS to Android in the BIOS,
and booted from the USB flash drive in legacy mode, which did take a while, but didn’t think it’d take THIS long.I was impatient enough to reboot and try booting using UEFI mode, with the same result. Just an annoying blinking logo.After checking some of the forums, I discovered this is a common issue with slower flash drives when using Resident mode, so rebooted and selected Guest mode.and waited for the required 5 minutes, eventually arriving at this.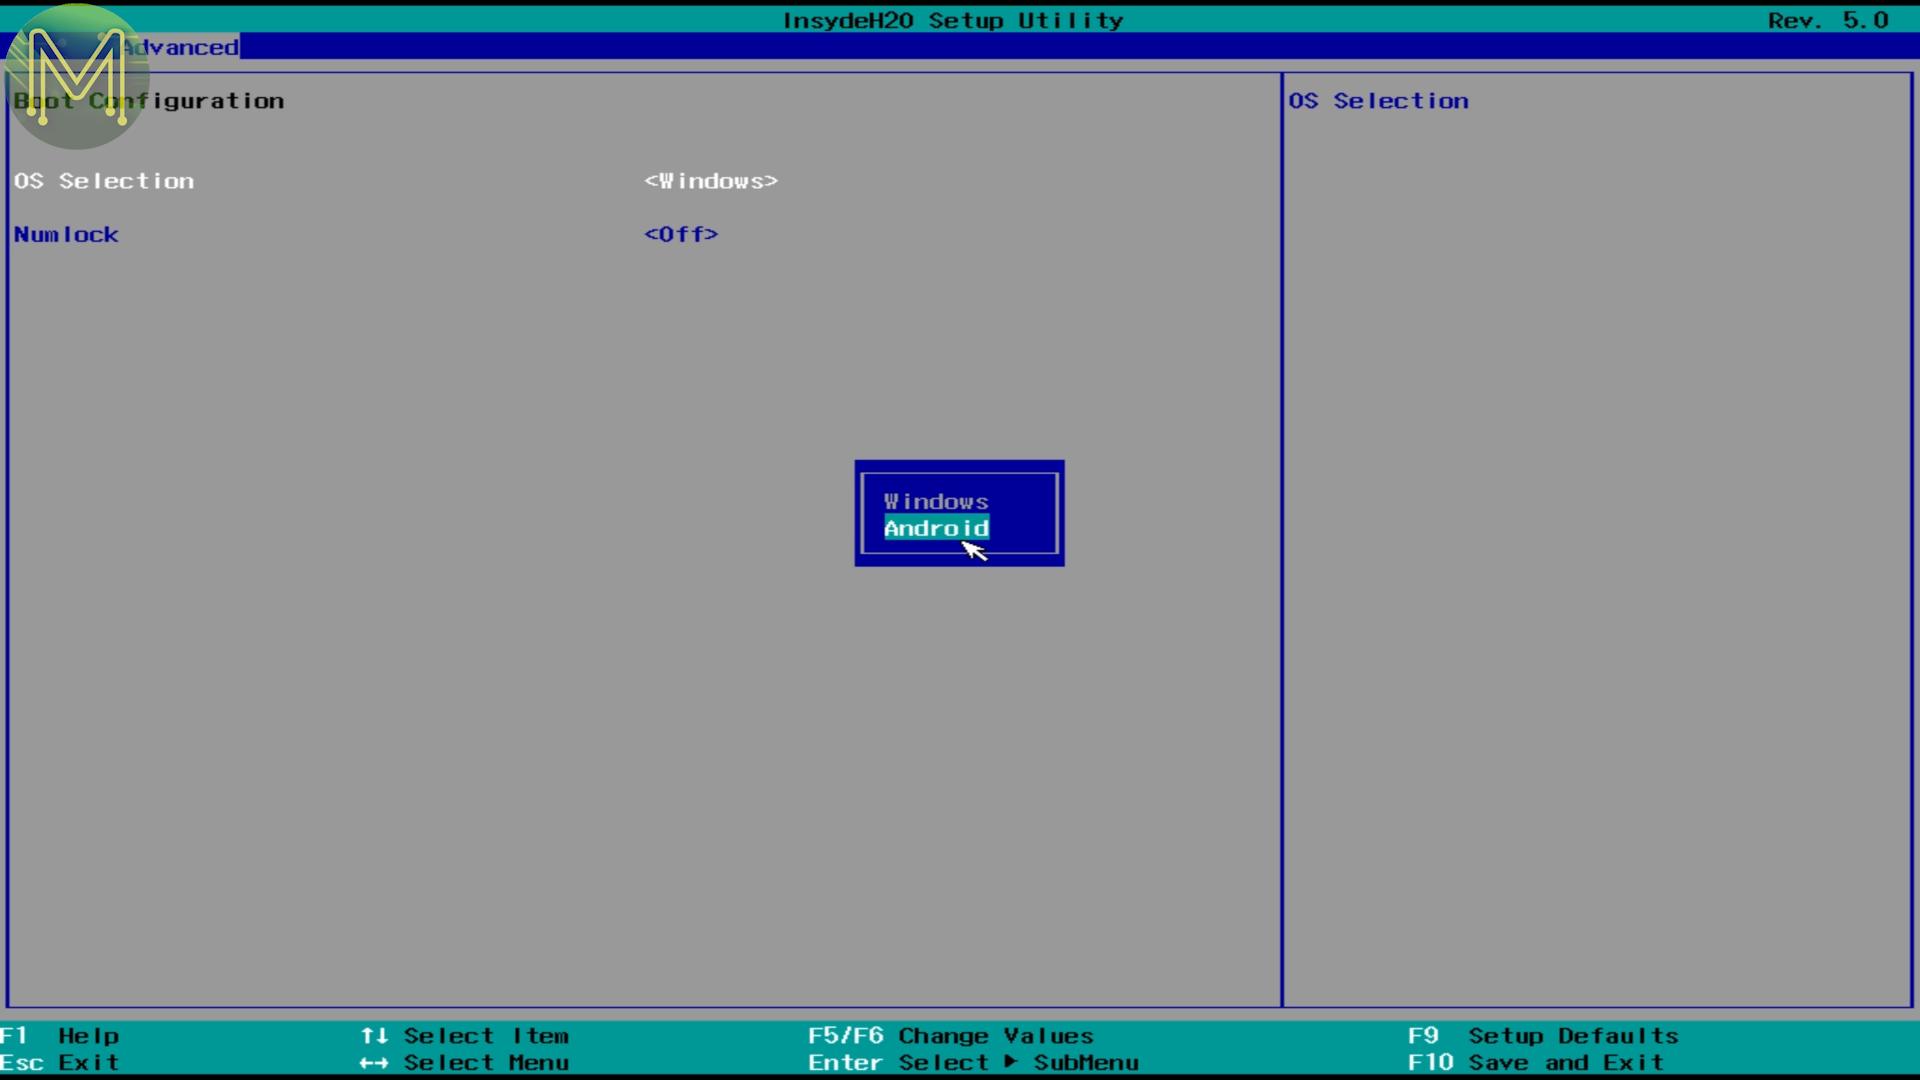


Performance tests
Next I installed a bunch of benchmarking tools, like AnTuTu, Geekbench 4, 3DMARK and GFXOpenGL.
AnTuTu
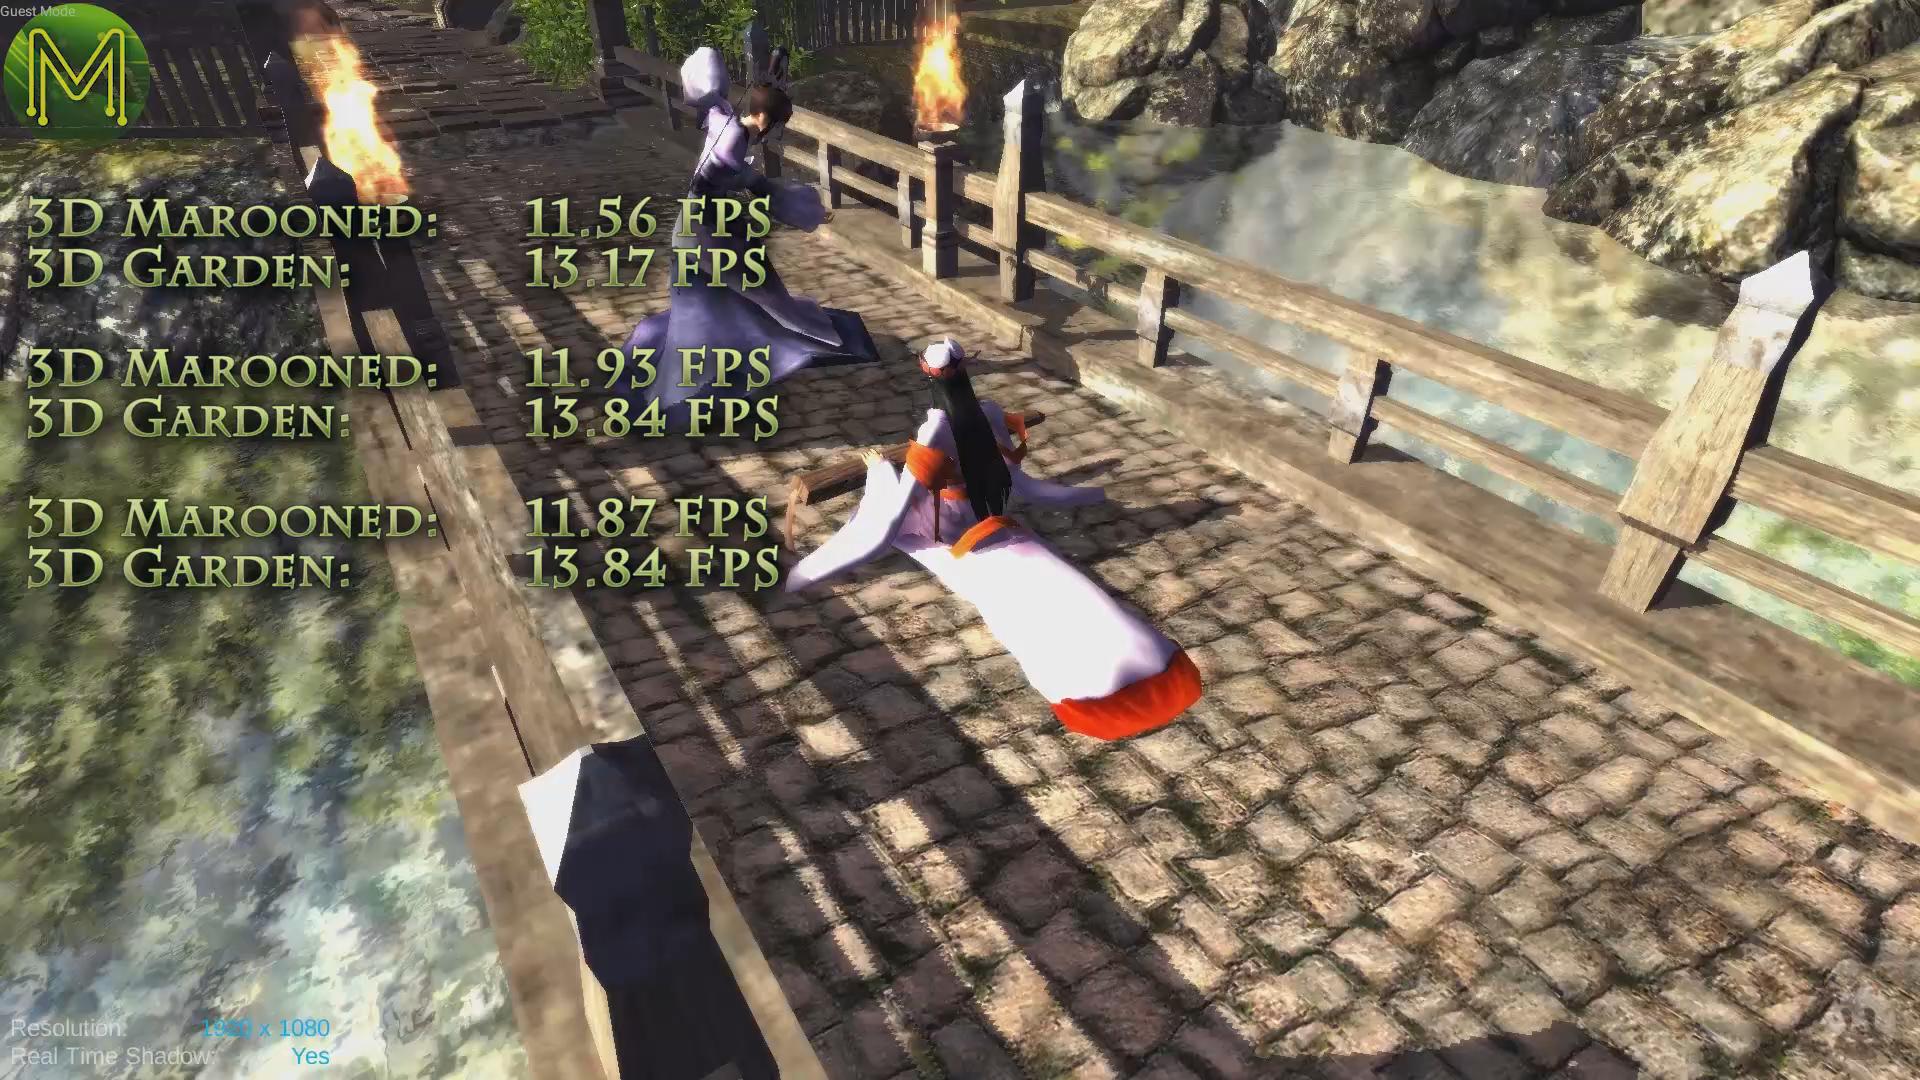
I have to say, just from an objective point of view, this board was responding much better than any other board I’ve looked at so far. A little bit jerky here and there, but generally pretty smooth. Still not as fast as an Uber gaming rig, but pretty decent bang for your buck.

- 3D Marooned: 11.56 FPS
- 3D Garden: 13.17 FPS
Just to be sure, I ran this test another two times, and ended up with similar results.
- 3D Marooned: 11.93 FPS
- 3D Marooned: 11.87 FPS
- 3D Garden: 13.84 FPS
- 3D Garden: 13.84 FPS
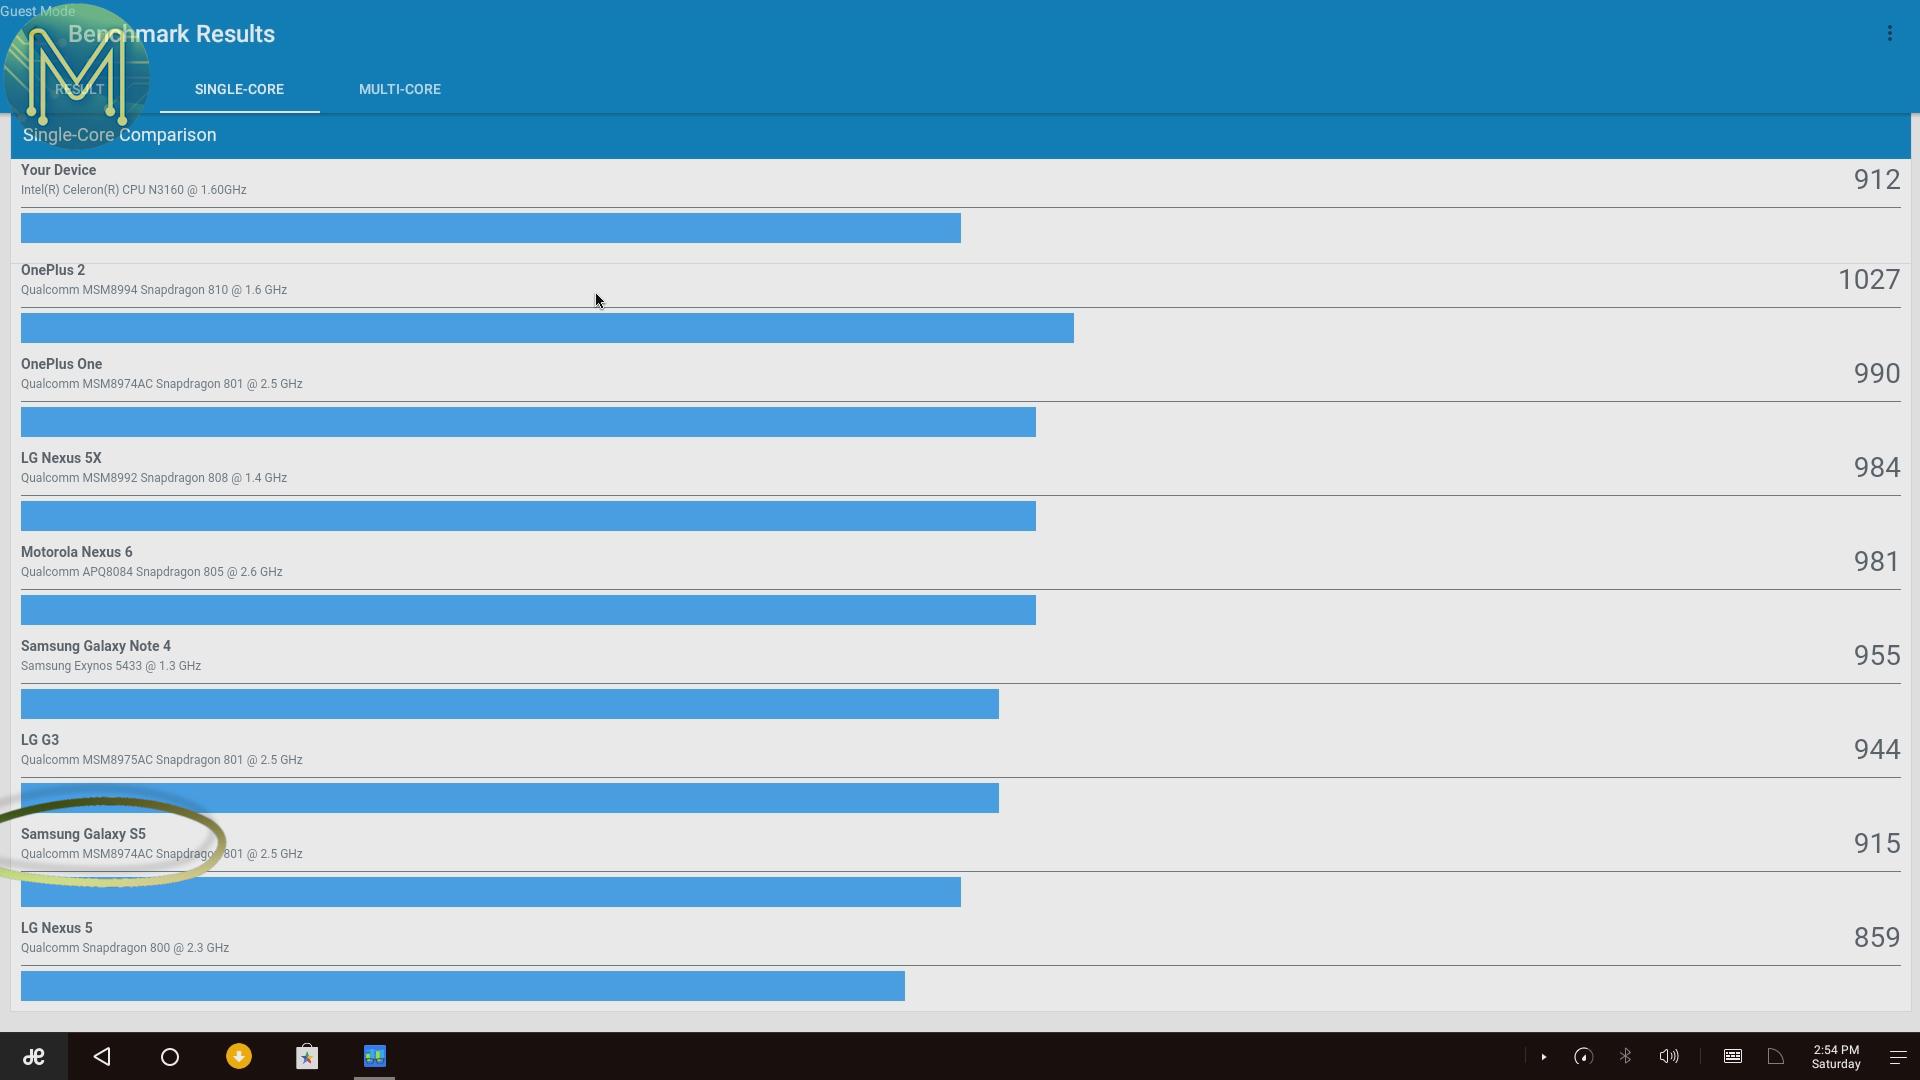
Running the compute benchmark, saw a score of 1,031, which once again places it around the Samsung Galaxy S5 mark.
3Dmark
Next up the 3Dmark benchmarks, which had some smooth 3D renders. Eventually landing with a decent score of 1,338. The brown line is the frames per second, the purple line is the average CPU frequency and blue is the peak CPU frequency. Once again never getting beyond the 1.7GHz limit.
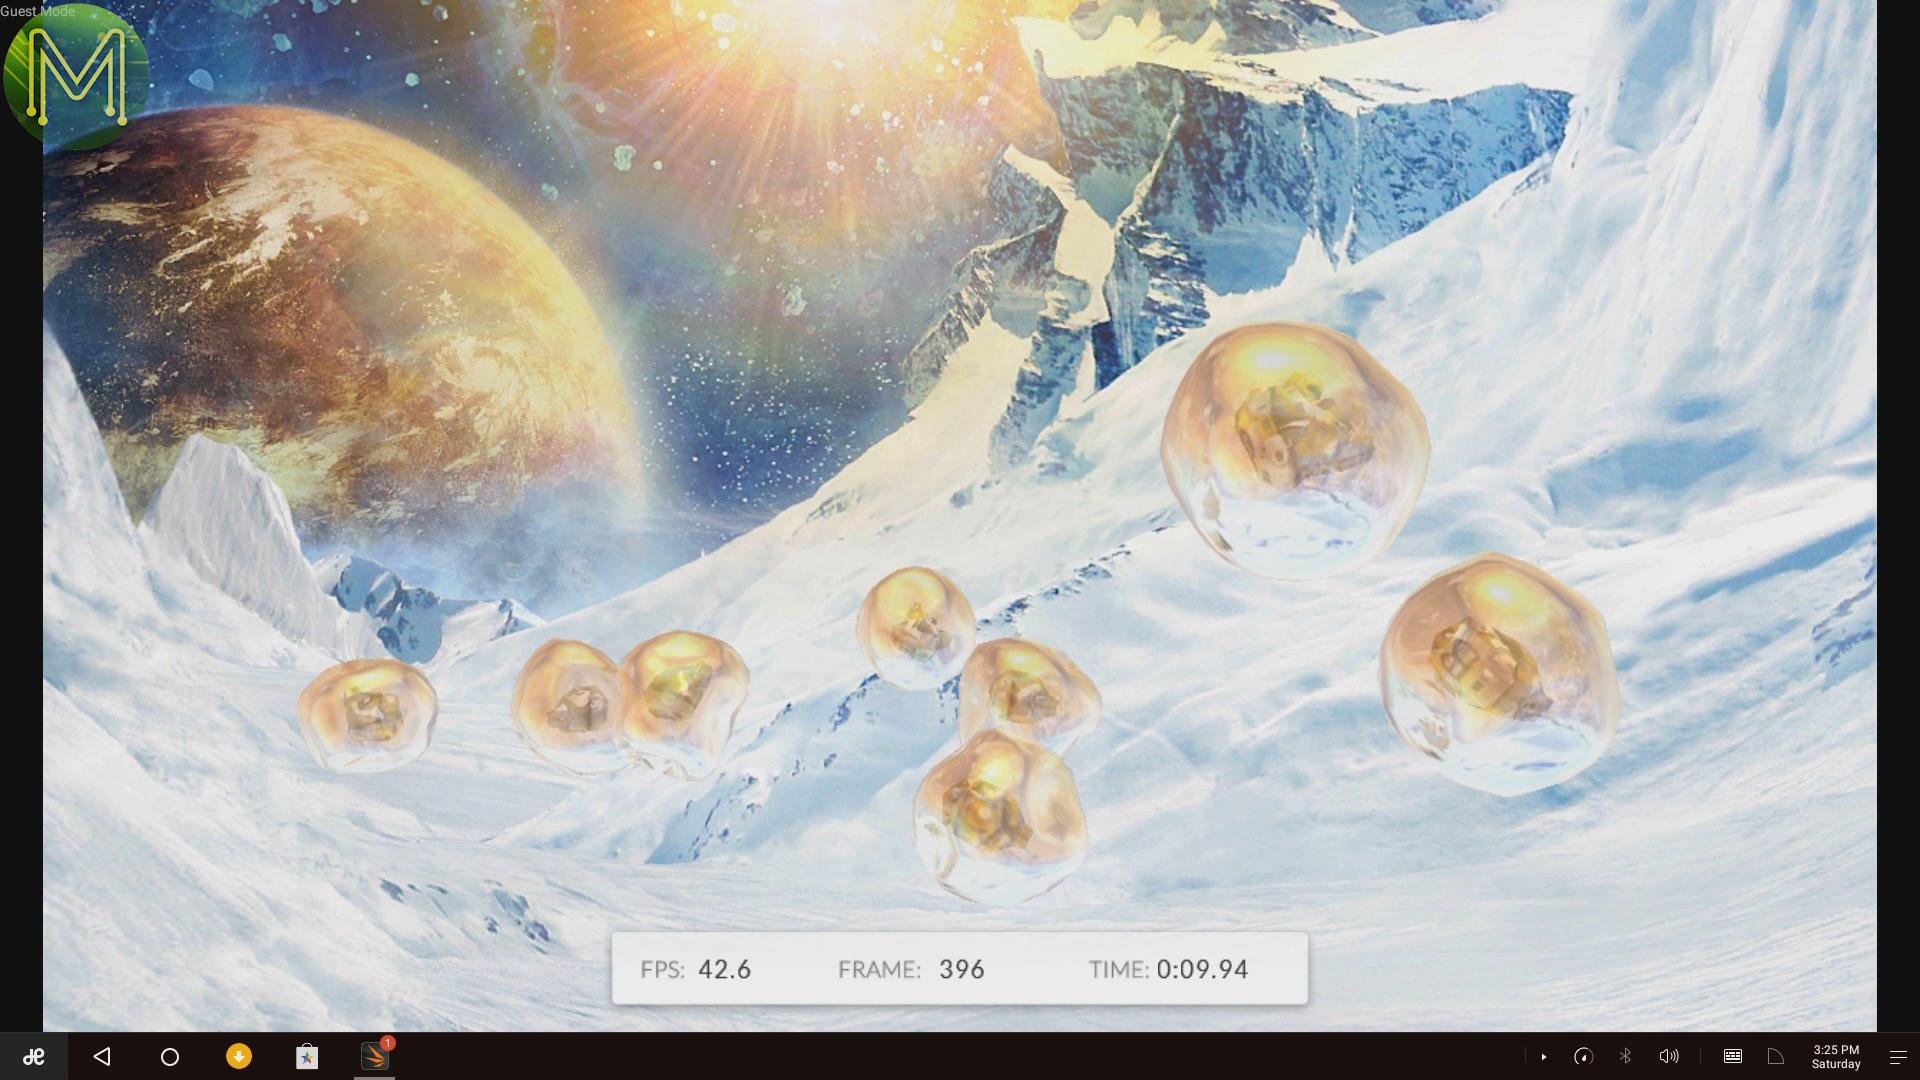
For comparison I also ran the Ice Storm benchmark, which if you saw my Pine64 review was very slow. This time it’s hitting around 60 FPS. At that frame rate everything is very smooth. Nice.Even the bouncy men had a peak FPS of 42.
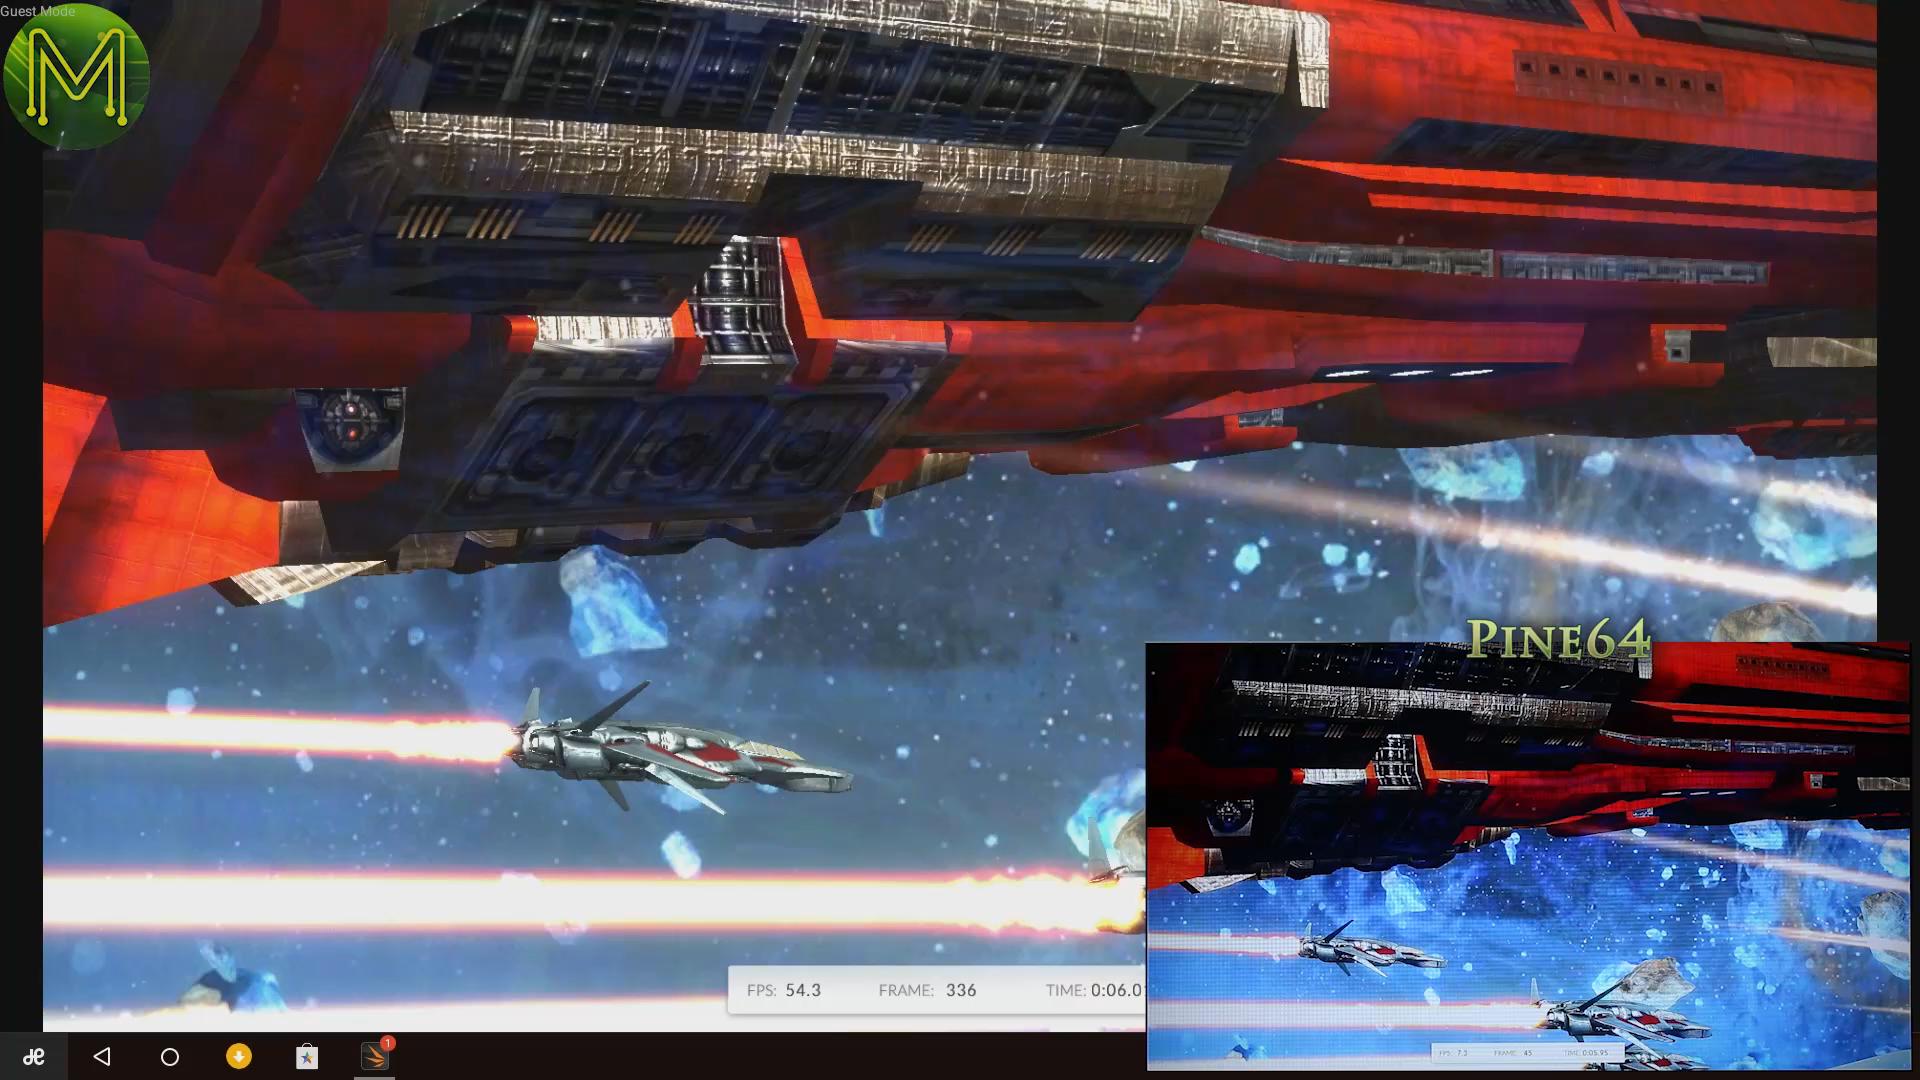
Ending up with a score of 11,823. The frame rate of this board is almost 10 times that of the Pine64.
11,823 vs 1,686
Work 2.0 performance
Next I ran a desktop workload test, which is supposed to test out desktop performance, but I came up with a weird score of 0, due probably to the video editing score.
So ran the test again, which ended up with the same result.
GFX BenchGL
Next on to GFX BenchGL testing. Which again showed up the decent frame rates.
Comparing it to the Pine64, well, there’s no match really. Once again, subjective testing showed that the UDOO-X86 is miles ahead of other boards. I’ll be running a video on graphics benchmarks soon which will give you a clearer picture of the differences between cheap SBCs.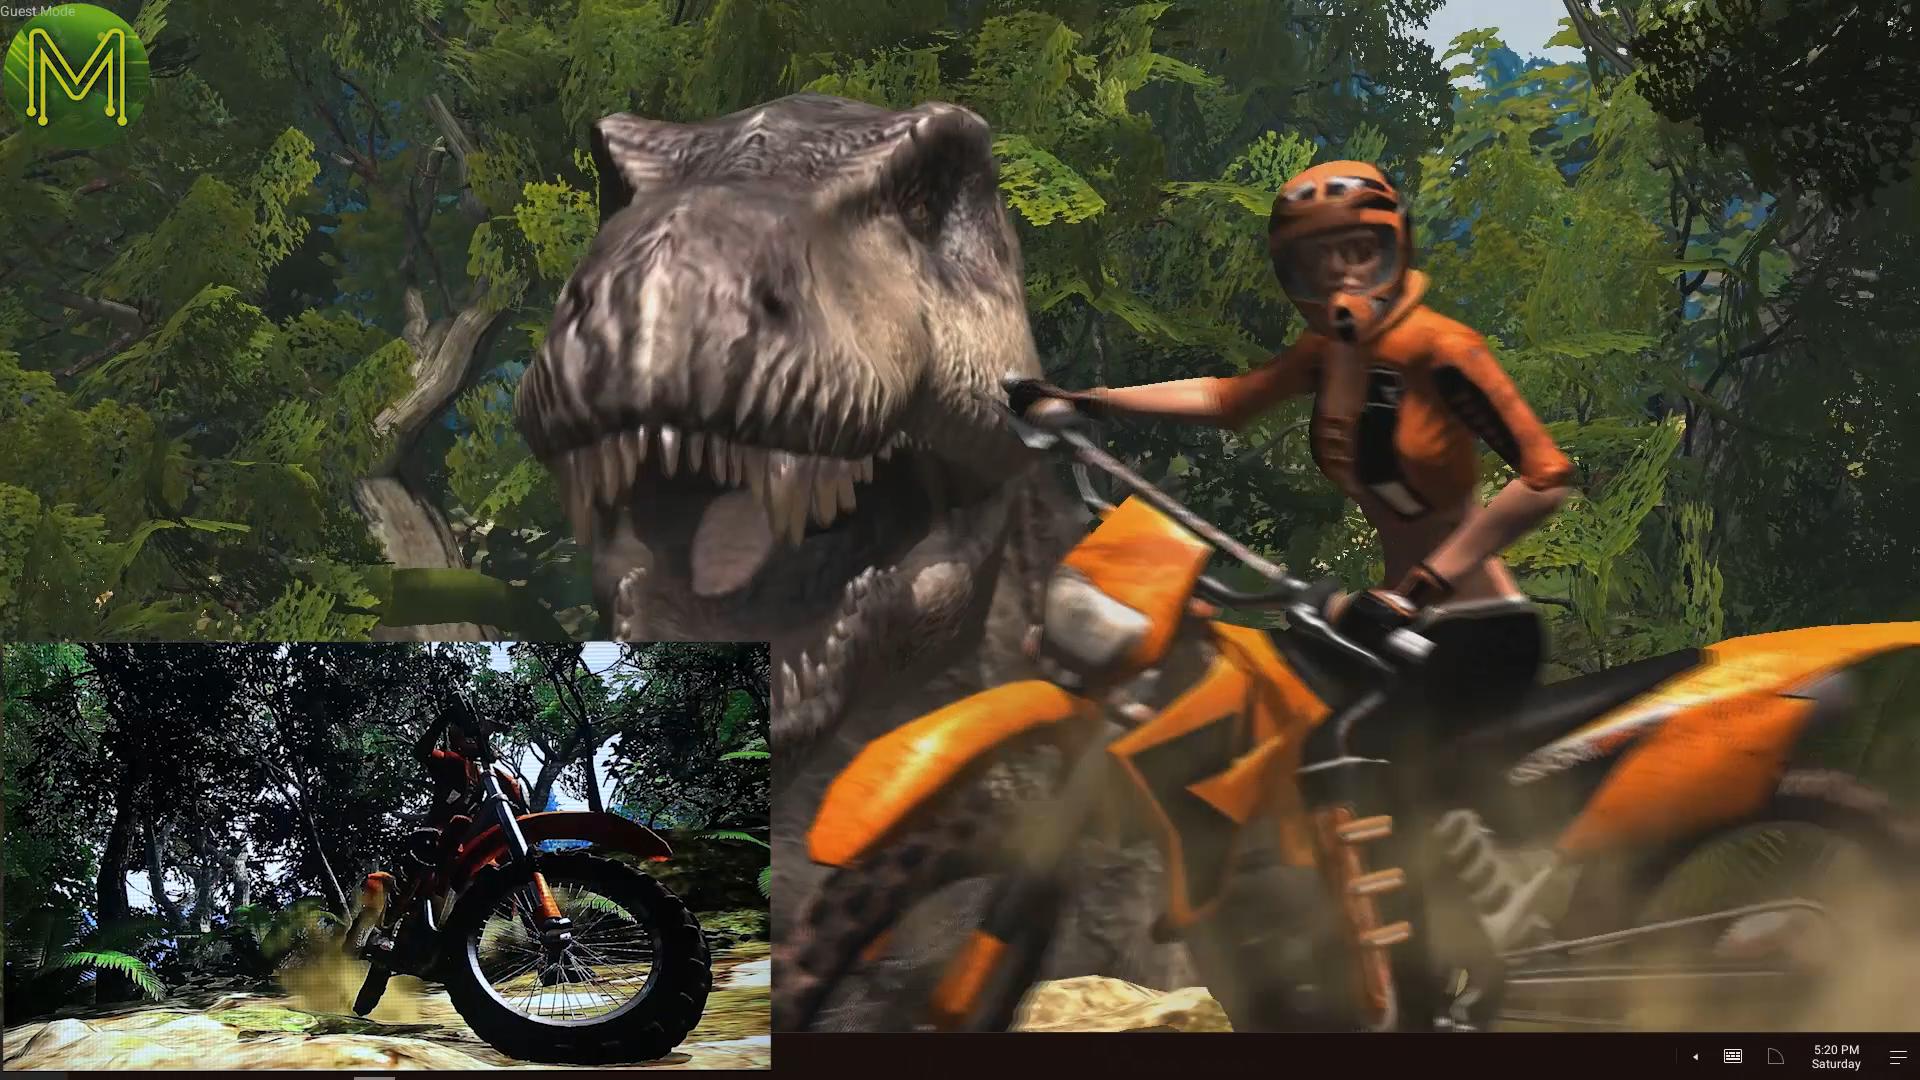
Overall performance placed it at around the Huawei Mate 8, which is on par with the HiKey960.
Taking a look at my power logs during these tests, there was an increase in current draw with a max of 1,266 mA and an average of 445 mA.
- Max current: 1265.8 mA
- Avg current: 444.6 mA
Summary
So what do I think of the UDOO-X86? Well the overall performance of the UDOO-X86 looks pretty good.
I’ve found that SATA performance is low but network speeds are high. Combine that with decent CPU grunt, low temperatures and low power consumption, one of the best uses of this board would be as part of a build cluster.
However, the excellent graphics and HDMI and two DP ports could make it a decent media center or budget desktop.
The X86 platform also opens this board up to a plethora of software options, more so than the ARM architecture.
And what score would I give it?
For the electronics Maker: 4.8.
and overall a 4.7.
Phoronix test stats
Frequency
- Max: 1,772 MHz
- Average: 1,315 MHz
- Median: 1,759 MHz
- Min: 480 MHz
Temperature
- Max: 67 C
- Average: 46 C
- Median: 48 C
- Min: 23 C
Phoronix install stats
Frequency
- Max: 1765 MHz
- Average: 707 MHz
- Median: 479 MHz
- Min: 478 MHz
Temperature
- Max: 56 C
- Average: 36 C
- Median: 32 C
- Min: 31 C